py_eddy_tracker.observations.observation.EddiesObservations
- class py_eddy_tracker.observations.observation.EddiesObservations(size=0, track_extra_variables=None, track_array_variables=0, array_variables=None, only_variables=None, raw_data=False)[source]
Bases:
objectClass to store eddy observations.
Methods
Add a new field.
Align the variable indices of two datasets.
Merge.
Give major axis in km with a given latitude
Return values evenly spaced with few numbers
Set contours as circles from radius and center data.
Check coherence between two datasets.
Return index of contour containing (x,y)
Copy with buffer for zarr.
Return the cost function between two obs.
How does it work on x bound ?
Create particles inside contour (Default : speed contour).
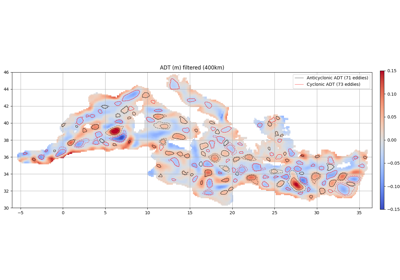
Plot the speed and effective (dashed) contour of the eddies
Plot colored contour of eddies
Use haversine distance for distance matrix between every self and other eddies.
Extract geographically with a bounding box.
Extract a subset of observations.
Produce description table of the fields available in this object
Get first obs of each trajectory.
Return colors as a cyclic list
Get filters to store in zarr for known variable
Get percentile of eddies in each bin
Count the eddies in each bin (use all pixels in each contour)
Return the mean of the eddies' variable in each bin
Build histograms.
Return obs from self at the index.
Insert other obs in self at the given index.
True for each point inside the effective contour of an eddy
Interpolate a grid on a center or contour with mean, min or max method
Get flag of the eddy's convexity
Yield observation group for each bin.
Get Last obs of each trajectory.
Load the netcdf or the zarr file.
Load data from netcdf.
Load data from zarr.
Return mask for all observations in one of polygons list
Return index and score computed on the effective contour.
Merge two datasets.
Compute an intersection between all filters after to evaluate each of them
Fill virtual obs (C).
Shift index with ref
Copy with fields listed remove
Scatter data.
Deduce link from cost matrix.
Time sub sampling
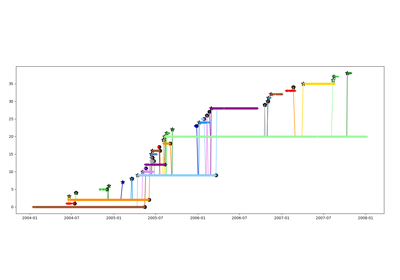
Track obs between self and other
Write a netcdf or zarr with eddy obs.
Attributes
Return dtype to build numpy array.
Return all the names of the variables.
Return period in days covered by the dataset
Return observations.
Give the time coverage.
- COLORS = ['sienna', 'red', 'darkorange', 'gold', 'palegreen', 'limegreen', 'forestgreen', 'mediumblue', 'dodgerblue', 'lightskyblue', 'violet', 'blueviolet', 'darkmagenta', 'darkgrey', 'dimgrey', 'steelblue']
- ELEMENTS = ['lon', 'lat', 'radius_s', 'radius_e', 'amplitude', 'speed_average', 'time', 'shape_error_e', 'shape_error_s', 'speed_area', 'effective_area', 'nb_contour_selected', 'num_point_e', 'num_point_s', 'height_max_speed_contour', 'height_external_contour', 'height_inner_contour']
- NB_COLORS = 16
- align_on(other, var_name='time', all_ref=False, **kwargs)[source]
Align the variable indices of two datasets.
- array_variables
- static basic_formula_ellipse_major_axis(lats, cmin=1.5, cmax=10.0, c0=1.5, lat1=13.5, lat2=5.0, degrees=False)[source]
Give major axis in km with a given latitude
- bins_stat(xname, bins=None, yname=None, method=None, mask=None)[source]
- Parameters:
xname (str,array) – variable to compute stats on
bins (array, None) – bins to perform statistics, if None bins = arange(variable.min(), variable.max() + 2)
yname (None,str,array) – variable used to apply method
method (None,str) – If None method counts the number of observations in each bin, can be “mean”, “std”
mask (None,array(bool)) – If defined use only True position
- Returns:
x array and y array
- Return type:
array,array
- circle_contour(only_virtual=False, factor=1)[source]
Set contours as circles from radius and center data.
- contains(x, y, intern=False)[source]
Return index of contour containing (x,y)
- Parameters:
x (array) – longitude
y (array) – latitude
intern (bool) – If true use speed contour instead of effective contour
- Returns:
indexs, -1 if no index
- Return type:
array[int32]
- static copy_data_to_zarr(handler_zarr, handler_eddies, sl_obs, buffer_size, factor, raw_data, scale_factor, add_offset)[source]
Copy with buffer for zarr.
Zarr need to get real value, and size could be huge, so we use a buffer to manage memory :param zarr_dataset handler_zarr: :param array handler_eddies: :param slice zarr_dataset sl_obs: :param int buffer_size: :param float factor: :param bool raw_data: :param None,float scale_factor: :param None,float add_offset:
- static cost_function(records_in, records_out, distance)[source]
Return the cost function between two obs.
\[cost = \sqrt{({Amp_{_{in}} - Amp_{_{out}} \over Amp_{_{in}}}) ^2 + ({Rspeed_{_{in}} - Rspeed_{_{out}} \over Rspeed_{_{in}}}) ^2 + ({distance \over 125}) ^2 }\]- Parameters:
records_in – starting observations
records_out – observations to associate
distance – computed between in and out
- classmethod cost_function_common_area(xy_in, xy_out, distance, intern=False)[source]
How does it work on x bound ?
- Parameters:
xy_in
xy_out
distance
intern (bool)
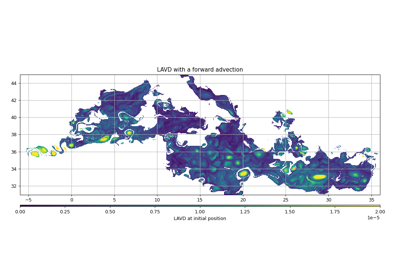
- create_particles(step, intern=True)[source]
Create particles inside contour (Default : speed contour). Avoid creating too large numpy arrays, only to be masked
- create_variable(handler_nc, kwargs_variable, attr_variable, data, scale_factor=None, add_offset=None, **kwargs)[source]
- create_variable_zarr(handler_zarr, kwargs_variable, attr_variable, data, scale_factor=None, add_offset=None, filters=None, compressor=None, chunck_size=2500000)[source]
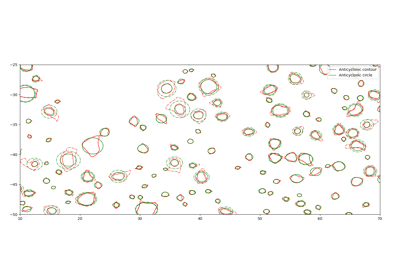
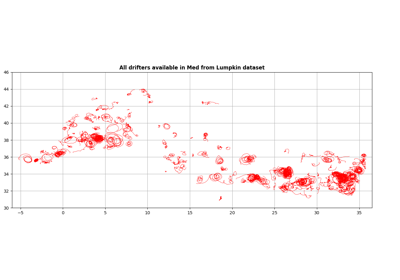
- display(ax, ref=None, extern_only=False, intern_only=False, **kwargs)[source]
Plot the speed and effective (dashed) contour of the eddies
- Parameters:
ax (matplotlib.axes.Axes) – matplotlib axe used to draw
ref (float,None) – if defined, all coordinates are wrapped with ref as western boundary
extern_only (bool) – if True, draw only the effective contour
intern_only (bool) – if True, draw only the speed contour
kwargs (dict) – look at
matplotlib.axes.Axes.plot()
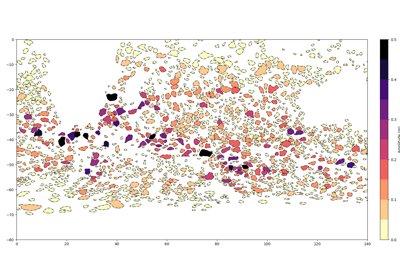
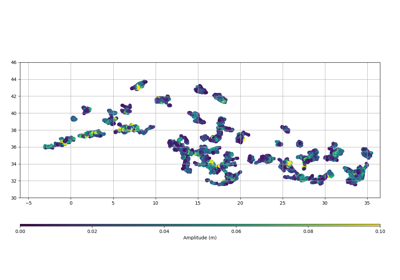
- display_color(ax, field, ref=None, intern=False, **kwargs)[source]
Plot colored contour of eddies
- Parameters:
ax (matplotlib.axes.Axes) – matplotlib axe used to draw
field (str,array) – color field
ref (float,None) – if defined, all coordinates are wrapped with ref as western boundary
intern (bool) – if True, draw the speed contour
kwargs (dict) – look at
matplotlib.collections.LineCollection()
- distance(other)[source]
Use haversine distance for distance matrix between every self and other eddies.
- property dtype
Return dtype to build numpy array.
- property elements
Return all the names of the variables.
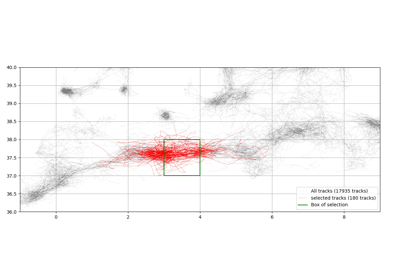
- extract_with_area(area, **kwargs)[source]
Extract geographically with a bounding box.
- Parameters:
area (dict) – 4 coordinates in a dictionary to specify bounding box (lower left corner and upper right corner)
kwargs (dict) – look at
extract_with_mask()
- Returns:
Return all eddy trajetories in bounds
- Return type:
area = dict(llcrnrlon=x0, llcrnrlat=y0, urcrnrlon=x1, urcrnrlat=y1)
- extract_with_mask(mask)[source]
Extract a subset of observations.
- Parameters:
mask (array(bool)) – mask to select observations
- Returns:
same object with selected observations
- Return type:
self
- property fields
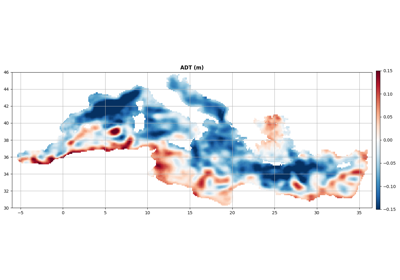
- filled(ax, varname=None, ref=None, intern=False, cmap='magma_r', lut=10, vmin=None, vmax=None, factor=1, **kwargs)[source]
- Parameters:
ax (matplotlib.axes.Axes) – matplotlib axe used to draw
varname (str,array,None) – variable used to fill the contours, or an array of same size than obs
ref (float,None) – if defined, all coordinates are wrapped with ref as western boundary
intern (bool) – if True draw speed contours instead of effective contours
cmap (str) – matplotlib colormap name
lut (int,None) – Number of colors in the colormap
vmin (float,None) – Min value of the colorbar
vmax (float,None) – Max value of the colorbar
factor (float) – multiply value by
- Returns:
Collection drawed
- Return type:
- static get_filters_zarr(name)[source]
Get filters to store in zarr for known variable
- Parameters:
name (str) – private variable name
- Return list:
filters list
- property global_attr
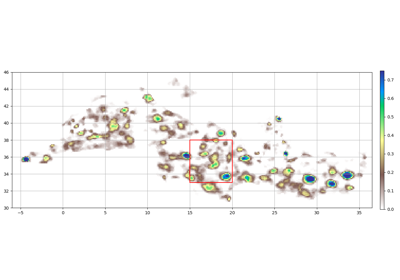
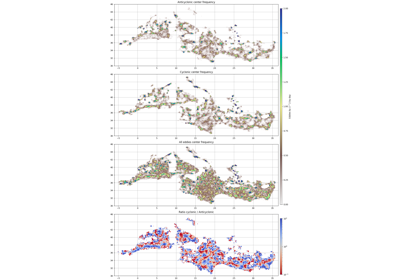
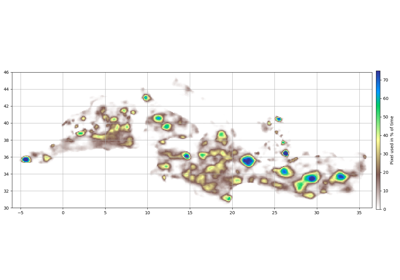
- grid_box_stat(bins, varname, method=50, data=None, filter=slice(None, None, None))[source]
Get percentile of eddies in each bin
- Parameters:
- Returns:
return grid of method
- Return type:
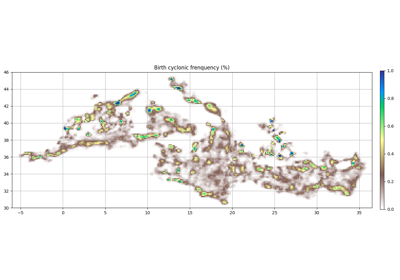
- grid_count(bins, intern=False, center=False, filter=slice(None, None, None))[source]
Count the eddies in each bin (use all pixels in each contour)
- Parameters:
- Returns:
return the grid of counts
- Return type:
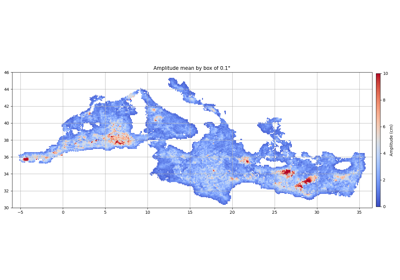
- grid_stat(bins, varname, data=None)[source]
Return the mean of the eddies’ variable in each bin
- Parameters:
bins ((numpy.array,numpy.array)) – bins (grid) to compute the mean on
varname (str) – name of variable to compute the mean on and output grid_name
data (array) – Array used to compute stat if defined
- Returns:
return the gridde mean variable
- Return type:
- interp_grid(grid_object, varname, i=None, method='center', dtype=None, intern=None)[source]
Interpolate a grid on a center or contour with mean, min or max method
- Parameters:
grid_object (py_eddy_tracker.dataset.grid.RegularGridDataset) – Handler of grid to interp
varname (str) – Name of variable to use
i (array[bool,int],None) – Index or mask to subset observations, it could avoid to build a specific dataset.
method (str) – ‘center’, ‘mean’, ‘max’, ‘min’, ‘nearest’
dtype (str) – if None we use var dtype
intern (bool) – Use extern or intern contour
- iter_on(xname, window=None, bins=None)[source]
Yield observation group for each bin.
- Parameters:
- Yield array,float,float:
index in self, lower bound, upper bound
- classmethod load_file(filename, **kwargs)[source]
Load the netcdf or the zarr file.
Load only latitude and longitude on the first 300 obs :
kwargs_latlon_300 = dict(
    include_vars=[
        "longitude",
        "latitude",
    ],
    indexs=dict(obs=slice(0, 300)),
)
small_dataset = TrackEddiesObservations.load_file(
    filename, **kwargs_latlon_300
)
For **kwargs look at
load_from_zarr()orload_from_netcdf()
- classmethod load_from_netcdf(filename, raw_data=False, remove_vars=None, include_vars=None, indexs=None, **class_kwargs)[source]
Load data from netcdf.
- Parameters:
filename (str,ExFileObject) – path or handler to load data
raw_data (bool) – If true load data without apply scale_factor and add_offset
remove_vars (None,list(str)) – List of variable name which will be not loaded
include_vars (None,list(str)) – If defined only this variable will be loaded
indexs (None,dict) – Indexes to load only a slice of data
class_kwargs – argument to set up observations class
- Returns:
Obsevations selected
- Return type:
class
- classmethod load_from_zarr(filename, raw_data=False, remove_vars=None, include_vars=None, indexs=None, buffer_size=5000000, **class_kwargs)[source]
Load data from zarr.
- Parameters:
filename (str,store) – path or store to load data
raw_data (bool) – If true load data without scale_factor and add_offset
remove_vars (None,list(str)) – List of variable name that will be not loaded
include_vars (None,list(str)) – If defined only this variable will be loaded
indexs (None,dict) – Indexes to load only a slice of data
buffer_size (int) – Size of buffer used to load zarr data
class_kwargs – argument to set up observations class
- Returns:
Obsevations selected
- Return type:
class
- mask_from_polygons(polygons)[source]
Return mask for all observations in one of polygons list
- Parameters:
polygons (list((array,array))) – list of x/y array which be used to identify observations
- match(other, i_self=None, i_other=None, method='overlap', intern=False, cmin=0, **kwargs)[source]
Return index and score computed on the effective contour.
- Parameters:
other (EddiesObservations) – Observations to compare
i_self (array[bool,int],None) – Index or mask to subset observations, it could avoid to build a specific dataset.
i_other (array[bool,int],None) – Index or mask to subset observations, it could avoid to build a specific dataset.
method (str) –
“overlap”: the score is computed with contours;
”circle”: circles are computed and used for score (TODO)
intern (bool) – if True, speed contour is used (default = effective contour)
cmin (float) – 0 < cmin < 1, return only couples with score >= cmin
kwargs (dict) – look at
vertice_overlap()
- Returns:
return the indices of the eddies in self coupled with eddies in other and their associated score
- Return type:
- merge_filters(*filters)[source]
Compute an intersection between all filters after to evaluate each of them
- property nb_days
Return period in days covered by the dataset
- Returns:
Number of days
- Return type:
- property obs
Return observations.
- observations
- only_variables
- property period
Give the time coverage. If collection is empty, return nan,nan
- period_
- propagate(previous_obs, current_obs, obs_to_extend, dead_track, nb_next, model)[source]
Fill virtual obs (C).
- Parameters:
previous_obs – previous obs from current (A)
current_obs – previous obs from virtual (B)
obs_to_extend
dead_track
nb_next
model
- Returns:
New position C = B + AB
- raw_data
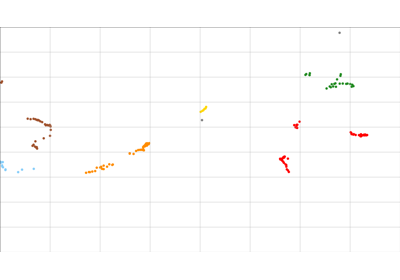
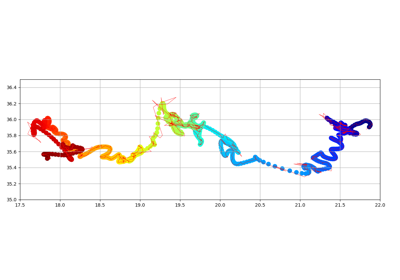
- scatter(ax, name=None, ref=None, factor=1, **kwargs)[source]
Scatter data.
- Parameters:
ax (matplotlib.axes.Axes) – matplotlib axe used to draw
name (str,array,None) – variable used to fill the contour, if None all elements have the same color
ref (float,None) – if defined, all coordinates are wrapped with ref as western boundary
factor (float) – multiply value by
kwargs (dict) – look at
matplotlib.axes.Axes.scatter()
- Returns:
scatter mappable
- property shape
- property sign_legend
- sign_type
- property time_datetime64
- track_array_variables
- track_extra_variables
- property tracks