Note
Go to the end to download the full example code. or to run this example in your browser via Binder
Birth and death
Following figures are based on https://doi.org/10.1016/j.pocean.2011.01.002
from matplotlib import pyplot as plt
import py_eddy_tracker_sample

from py_eddy_tracker.observations.tracking import TrackEddiesObservations
def start_axes(title):
    fig = plt.figure(figsize=(13, 5))
    ax = fig.add_axes([0.03, 0.03, 0.90, 0.94])
    ax.set_xlim(-6, 36.5), ax.set_ylim(30, 46)
    ax.set_aspect("equal")
    ax.set_title(title)
    return ax


def update_axes(ax, mappable=None):
    ax.grid()
    if mappable:
        plt.colorbar(mappable, cax=ax.figure.add_axes([0.95, 0.05, 0.01, 0.9]))
Load an experimental med atlas over a period of 26 years (1993-2019)
kwargs_load = dict(
    include_vars=(
        "longitude",
        "latitude",
        "observation_number",
        "track",
        "time",
        "speed_contour_longitude",
        "speed_contour_latitude",
    )
)
a = TrackEddiesObservations.load_file(
    py_eddy_tracker_sample.get_demo_path(
        "eddies_med_adt_allsat_dt2018/Anticyclonic.zarr"
    )
)
c = TrackEddiesObservations.load_file(
    py_eddy_tracker_sample.get_demo_path("eddies_med_adt_allsat_dt2018/Cyclonic.zarr")
)
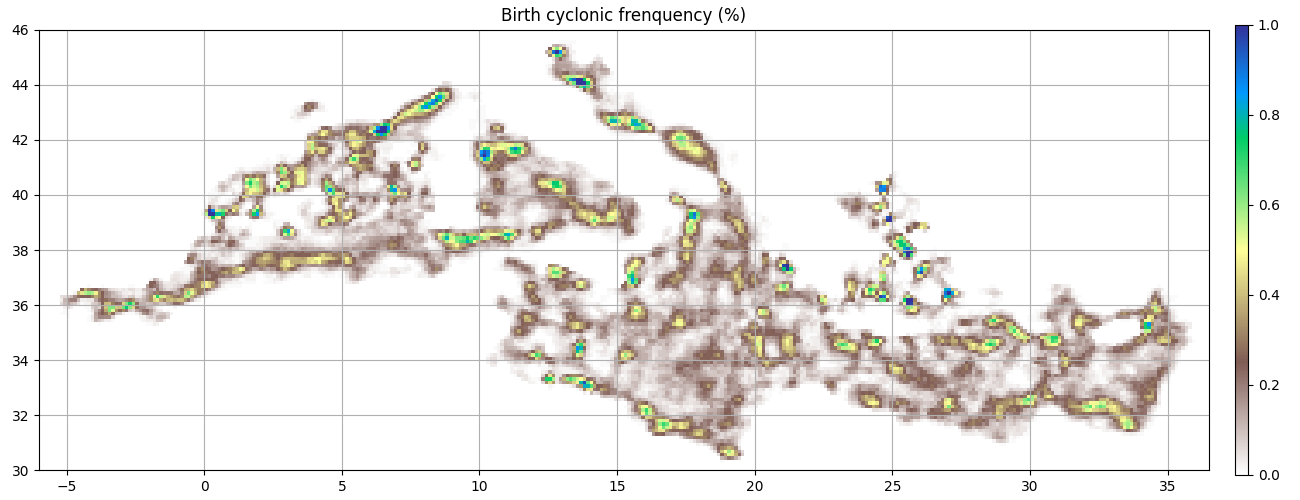
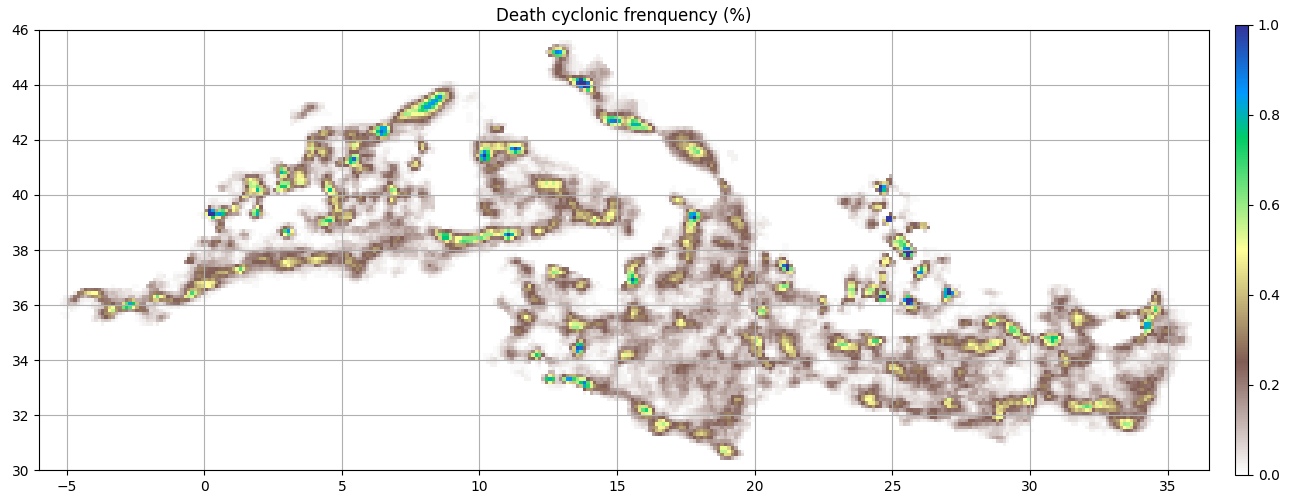
Cyclonic
ax = start_axes("Birth cyclonic frenquency (%)")
g_c_first = c.first_obs().grid_count(bins, intern=True)
m = g_c_first.display(ax, **kwargs)
update_axes(ax, m)
ax = start_axes("Death cyclonic frenquency (%)")
g_c_last = c.last_obs().grid_count(bins, intern=True)
m = g_c_last.display(ax, **kwargs)
update_axes(ax, m)
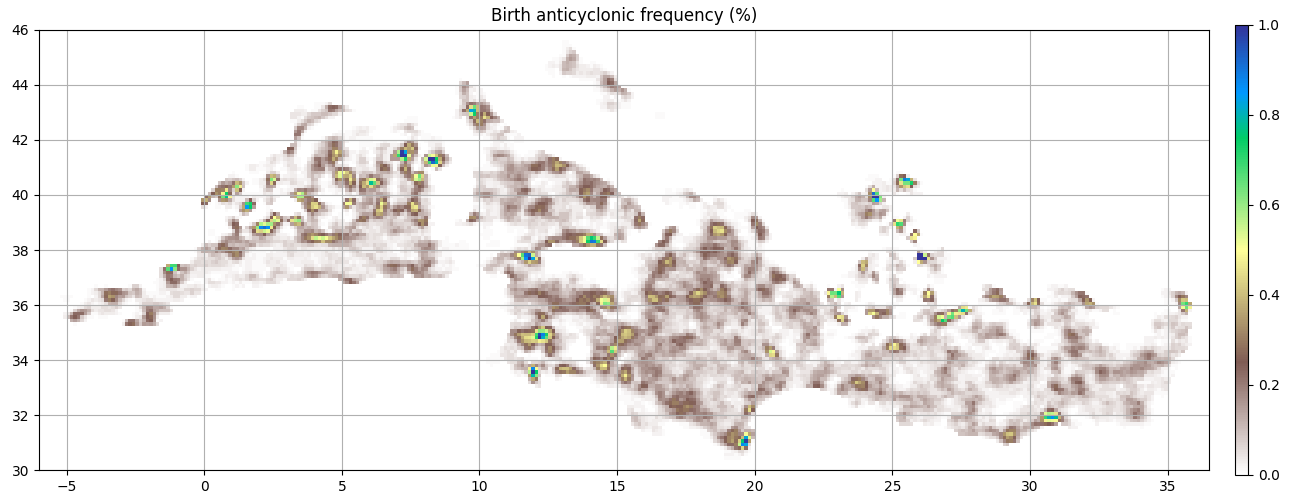
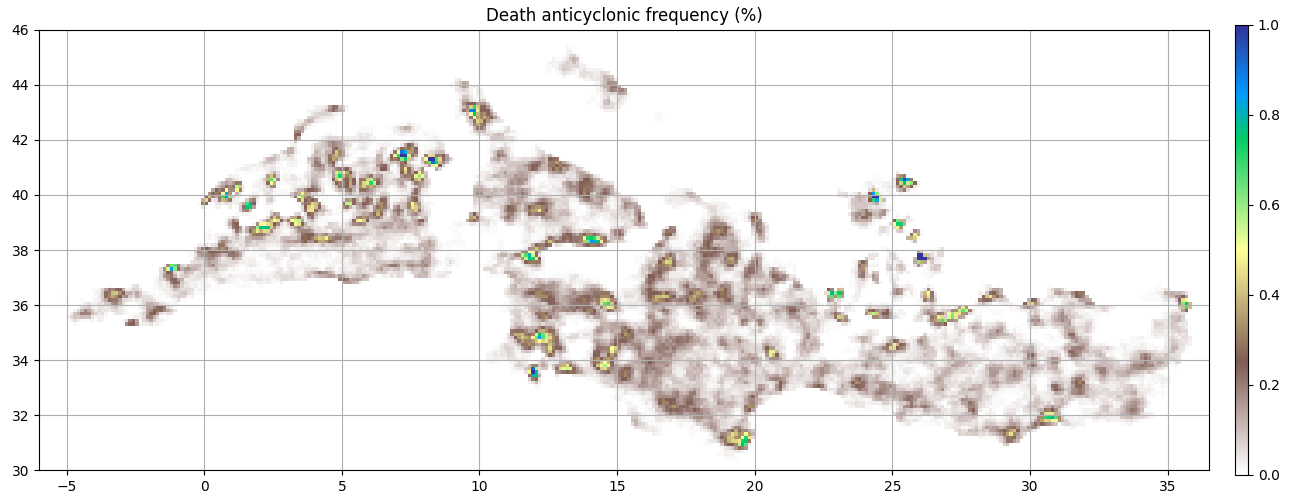
Anticyclonic
ax = start_axes("Birth anticyclonic frequency (%)")
g_a_first = a.first_obs().grid_count(bins, intern=True)
m = g_a_first.display(ax, **kwargs)
update_axes(ax, m)
ax = start_axes("Death anticyclonic frequency (%)")
g_a_last = a.last_obs().grid_count(bins, intern=True)
m = g_a_last.display(ax, **kwargs)
update_axes(ax, m)
Total running time of the script: (0 minutes 1.877 seconds)