Note
Go to the end to download the full example code. or to run this example in your browser via Binder
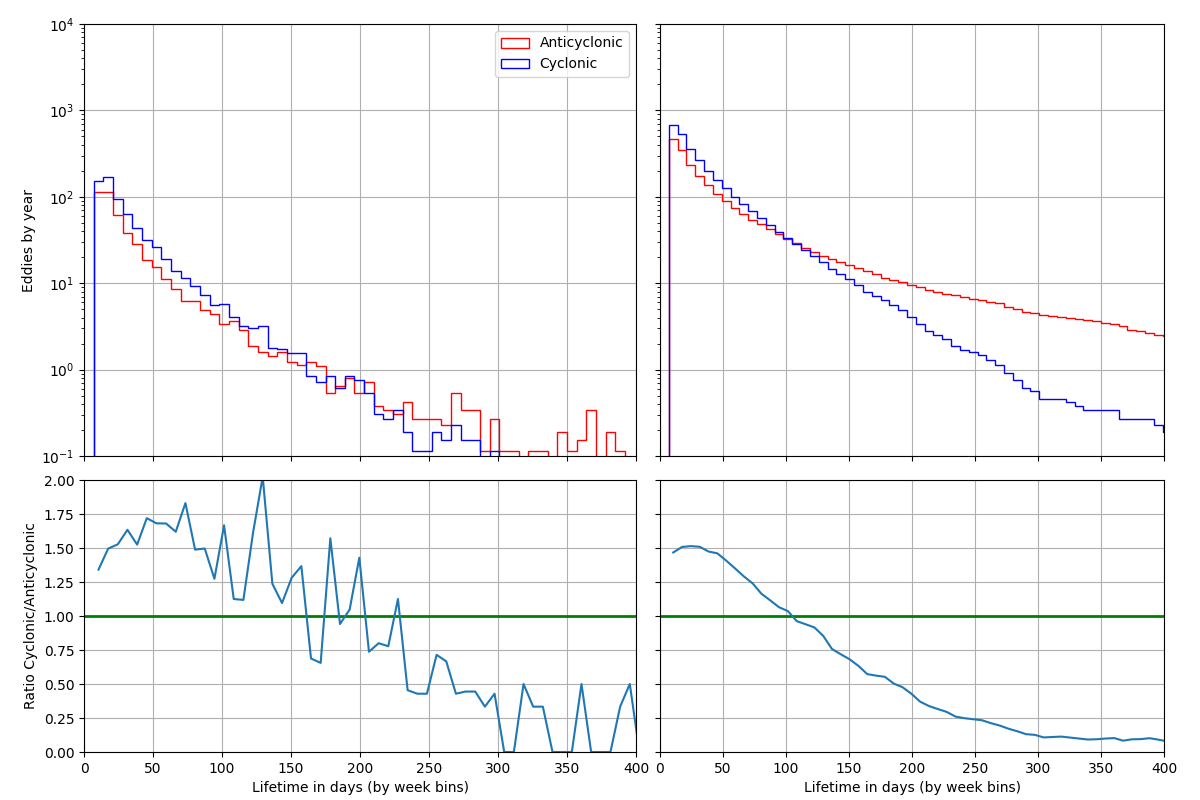
Lifetime Histogram
Load an experimental med atlas over a period of 26 years (1993-2019)
a = TrackEddiesObservations.load_file(
    py_eddy_tracker_sample.get_demo_path(
        "eddies_med_adt_allsat_dt2018/Anticyclonic.zarr"
    )
)
c = TrackEddiesObservations.load_file(
    py_eddy_tracker_sample.get_demo_path("eddies_med_adt_allsat_dt2018/Cyclonic.zarr")
)
nb_year = (a.period[1] - a.period[0] + 1) / 365.25
Setup axes
figure = plt.figure(figsize=(12, 8))
ax_ratio_cum = figure.add_axes([0.55, 0.06, 0.42, 0.34])
ax_ratio = figure.add_axes([0.07, 0.06, 0.46, 0.34])
ax_cum = figure.add_axes([0.55, 0.43, 0.42, 0.54])
ax = figure.add_axes([0.07, 0.43, 0.46, 0.54])
ax.set_ylabel("Eddies by year")
ax_ratio.set_ylabel("Ratio Cyclonic/Anticyclonic")
for ax_ in (ax, ax_cum, ax_ratio_cum, ax_ratio):
    ax_.set_xlim(0, 400)
    if ax_ in (ax, ax_cum):
        ax_.set_ylim(1e-1, 1e4), ax_.set_yscale("log")
    else:
        ax_.set_xlabel("Lifetime in days (by week bins)")
        ax_.set_ylim(0, 2)
        ax_.axhline(1, color="g", lw=2)
    ax_.grid()
ax_cum.xaxis.set_ticklabels([]), ax_cum.yaxis.set_ticklabels([])
ax.xaxis.set_ticklabels([]), ax_ratio_cum.yaxis.set_ticklabels([])

# plot data
bin_hist = arange(7, 2000, 7)
x = (bin_hist[1:] + bin_hist[:-1]) / 2.0
a_nb, c_nb = a.nb_obs_by_track, c.nb_obs_by_track
a_nb, c_nb = a_nb[a_nb != 0], c_nb[c_nb != 0]
w_a, w_c = ones(a_nb.shape) / nb_year, ones(c_nb.shape) / nb_year
kwargs_a = dict(histtype="step", bins=bin_hist, x=a_nb, color="r", weights=w_a)
kwargs_c = dict(histtype="step", bins=bin_hist, x=c_nb, color="b", weights=w_c)
cum_a, _, _ = ax_cum.hist(cumulative=-1, **kwargs_a)
cum_c, _, _ = ax_cum.hist(cumulative=-1, **kwargs_c)
nb_a, _, _ = ax.hist(label="Anticyclonic", **kwargs_a)
nb_c, _, _ = ax.hist(label="Cyclonic", **kwargs_c)
ax_ratio_cum.plot(x, cum_c / cum_a)
ax_ratio.plot(x, nb_c / nb_a)
ax.legend()
/home/docs/checkouts/readthedocs.org/user_builds/py-eddy-tracker/checkouts/latest/examples/10_tracking_diagnostics/pet_lifetime.py:57: RuntimeWarning: invalid value encountered in divide
  ax_ratio_cum.plot(x, cum_c / cum_a)
/home/docs/checkouts/readthedocs.org/user_builds/py-eddy-tracker/checkouts/latest/examples/10_tracking_diagnostics/pet_lifetime.py:58: RuntimeWarning: divide by zero encountered in divide
  ax_ratio.plot(x, nb_c / nb_a)
/home/docs/checkouts/readthedocs.org/user_builds/py-eddy-tracker/checkouts/latest/examples/10_tracking_diagnostics/pet_lifetime.py:58: RuntimeWarning: invalid value encountered in divide
  ax_ratio.plot(x, nb_c / nb_a)

<matplotlib.legend.Legend object at 0x74903c47a600>
Total running time of the script: (0 minutes 1.435 seconds)