Note
Go to the end to download the full example code. or to run this example in your browser via Binder
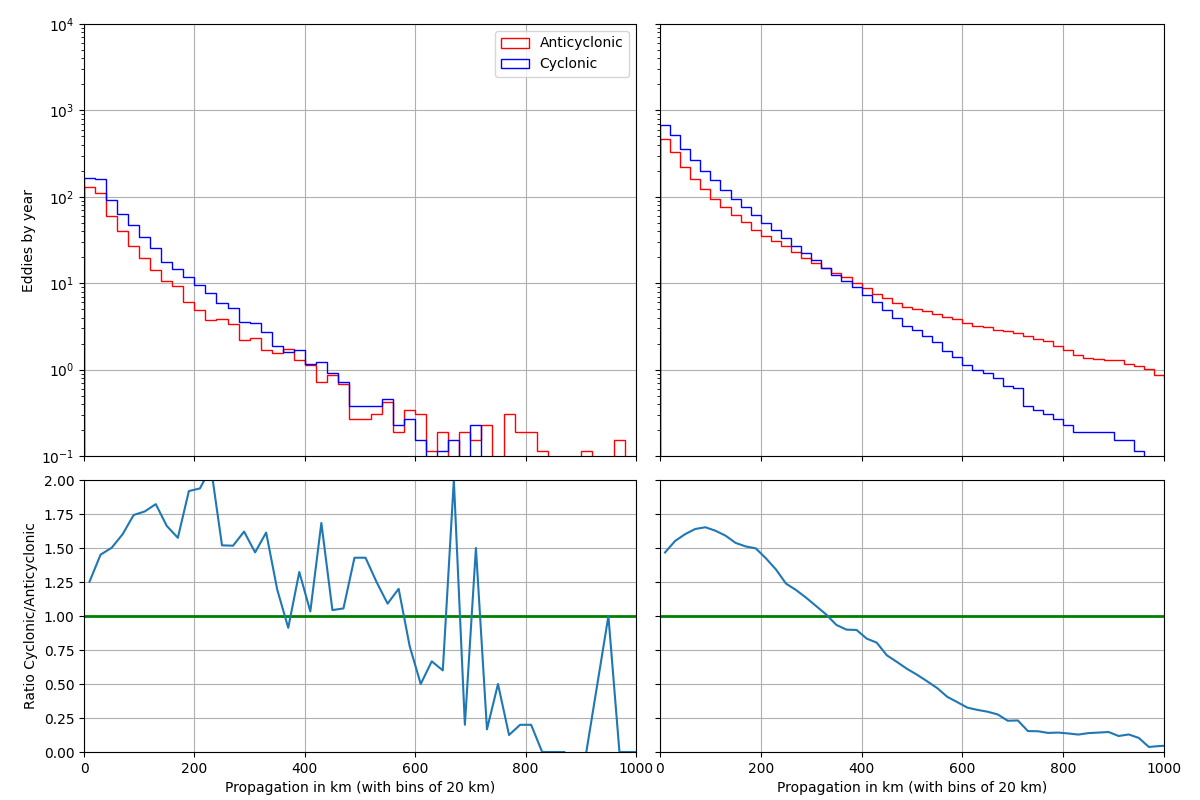
Propagation Histogram
from matplotlib import pyplot as plt
from numpy import arange, ones
import py_eddy_tracker_sample

from py_eddy_tracker.generic import cumsum_by_track
from py_eddy_tracker.observations.tracking import TrackEddiesObservations
Load an experimental med atlas over a period of 26 years (1993-2019)
a = TrackEddiesObservations.load_file(
    py_eddy_tracker_sample.get_demo_path(
        "eddies_med_adt_allsat_dt2018/Anticyclonic.zarr"
    )
)
c = TrackEddiesObservations.load_file(
    py_eddy_tracker_sample.get_demo_path("eddies_med_adt_allsat_dt2018/Cyclonic.zarr")
)
nb_year = (a.period[1] - a.period[0] + 1) / 365.25
Filtering position to remove noisy position
a.position_filter(median_half_window=1, loess_half_window=5)
c.position_filter(median_half_window=1, loess_half_window=5)
Compute curvilign distance
i0, nb = a.index_from_track, a.nb_obs_by_track
d_a = cumsum_by_track(a.distance_to_next(), a.tracks)[(i0 - 1 + nb)[nb != 0]] / 1000.0
i0, nb = c.index_from_track, c.nb_obs_by_track
d_c = cumsum_by_track(c.distance_to_next(), c.tracks)[(i0 - 1 + nb)[nb != 0]] / 1000.0
Setup axes
figure = plt.figure(figsize=(12, 8))
ax_ratio_cum = figure.add_axes([0.55, 0.06, 0.42, 0.34])
ax_ratio = figure.add_axes([0.07, 0.06, 0.46, 0.34])
ax_cum = figure.add_axes([0.55, 0.43, 0.42, 0.54])
ax = figure.add_axes([0.07, 0.43, 0.46, 0.54])
ax.set_ylabel("Eddies by year")
ax_ratio.set_ylabel("Ratio Cyclonic/Anticyclonic")
for ax_ in (ax, ax_cum, ax_ratio_cum, ax_ratio):
    ax_.set_xlim(0, 1000)
    if ax_ in (ax, ax_cum):
        ax_.set_ylim(1e-1, 1e4), ax_.set_yscale("log")
    else:
        ax_.set_xlabel("Propagation in km (with bins of 20 km)")
        ax_.set_ylim(0, 2)
        ax_.axhline(1, color="g", lw=2)
    ax_.grid()
ax_cum.xaxis.set_ticklabels([]), ax_cum.yaxis.set_ticklabels([])
ax.xaxis.set_ticklabels([]), ax_ratio_cum.yaxis.set_ticklabels([])

# plot data
bin_hist = arange(0, 2000, 20)
x = (bin_hist[1:] + bin_hist[:-1]) / 2.0
w_a, w_c = ones(d_a.shape) / nb_year, ones(d_c.shape) / nb_year
kwargs_a = dict(histtype="step", bins=bin_hist, x=d_a, color="r", weights=w_a)
kwargs_c = dict(histtype="step", bins=bin_hist, x=d_c, color="b", weights=w_c)
cum_a, _, _ = ax_cum.hist(cumulative=-1, **kwargs_a)
cum_c, _, _ = ax_cum.hist(cumulative=-1, **kwargs_c)
nb_a, _, _ = ax.hist(label="Anticyclonic", **kwargs_a)
nb_c, _, _ = ax.hist(label="Cyclonic", **kwargs_c)
ax_ratio_cum.plot(x, cum_c / cum_a)
ax_ratio.plot(x, nb_c / nb_a)
ax.legend()
/home/docs/checkouts/readthedocs.org/user_builds/py-eddy-tracker/checkouts/latest/examples/10_tracking_diagnostics/pet_propagation.py:68: RuntimeWarning: invalid value encountered in divide
  ax_ratio_cum.plot(x, cum_c / cum_a)
/home/docs/checkouts/readthedocs.org/user_builds/py-eddy-tracker/checkouts/latest/examples/10_tracking_diagnostics/pet_propagation.py:69: RuntimeWarning: divide by zero encountered in divide
  ax_ratio.plot(x, nb_c / nb_a)
/home/docs/checkouts/readthedocs.org/user_builds/py-eddy-tracker/checkouts/latest/examples/10_tracking_diagnostics/pet_propagation.py:69: RuntimeWarning: invalid value encountered in divide
  ax_ratio.plot(x, nb_c / nb_a)

<matplotlib.legend.Legend object at 0x74903449a600>
Total running time of the script: (0 minutes 1.932 seconds)