Note
Go to the end to download the full example code. or to run this example in your browser via Binder
Network Analysis
from matplotlib import pyplot as plt
from numpy import ma

from py_eddy_tracker.data import get_remote_demo_sample
from py_eddy_tracker.gui import GUI_AXES
from py_eddy_tracker.observations.network import NetworkObservations

n = NetworkObservations.load_file(
    get_remote_demo_sample(
        "eddies_med_adt_allsat_dt2018_err70_filt500_order1/Anticyclonic_network.nc"
    )
)
Parameters
Functions
def start_axes(title):
    fig = plt.figure(figsize=(13, 5))
    ax = fig.add_axes([0.03, 0.03, 0.90, 0.94], projection=GUI_AXES)
    ax.set_xlim(-6, 36.5), ax.set_ylim(30, 46)
    ax.set_aspect("equal")
    ax.set_title(title, weight="bold")
    return ax


def update_axes(ax, mappable=None):
    ax.grid()
    if mappable:
        return plt.colorbar(mappable, cax=ax.figure.add_axes([0.94, 0.05, 0.01, 0.9]))
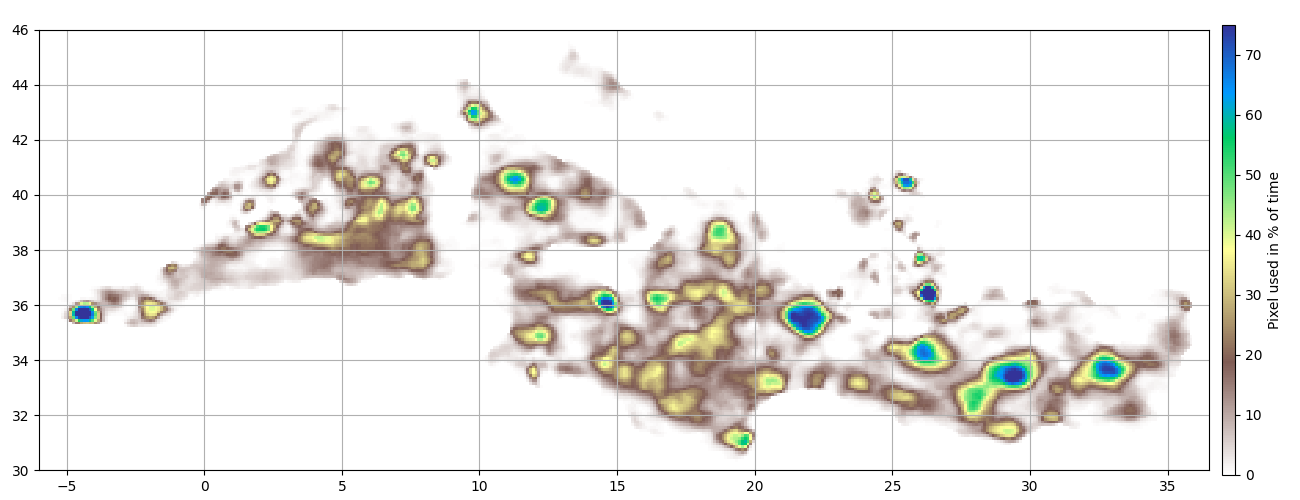
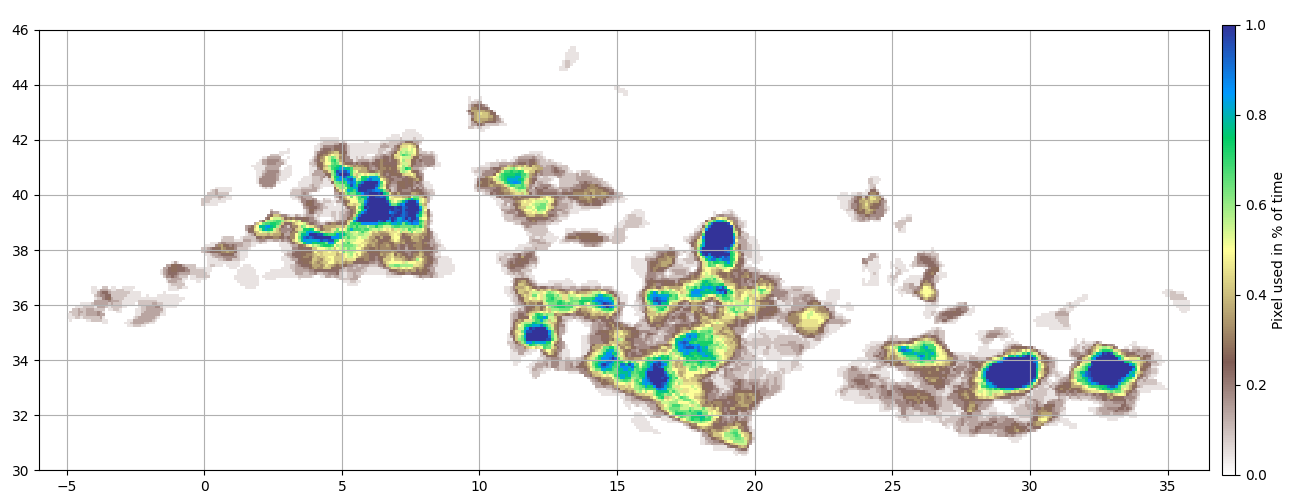
All
Display the % of time each pixel (1/10°) is within an anticyclonic network
ax = start_axes("")
g_all = n.grid_count(bins)
m = g_all.display(ax, **kw_time, vmin=0, vmax=75)
update_axes(ax, m).set_label("Pixel used in % of time")
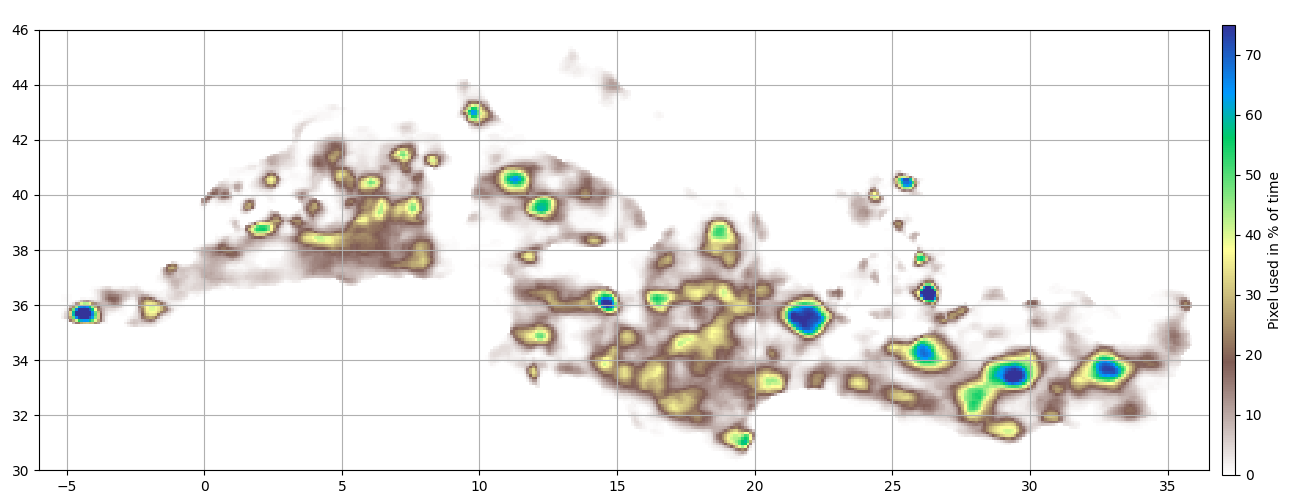
Network longer than 10 days
Display the % of time each pixel (1/10°) is within an anticyclonic network which total lifetime in longer than 10 days
ax = start_axes("")
n10 = n.longer_than(10)
g_10 = n10.grid_count(bins)
m = g_10.display(ax, **kw_time, vmin=0, vmax=75)
update_axes(ax, m).set_label("Pixel used in % of time")
Ratio
Ratio between the longer and total presence
Blue = mostly short networks
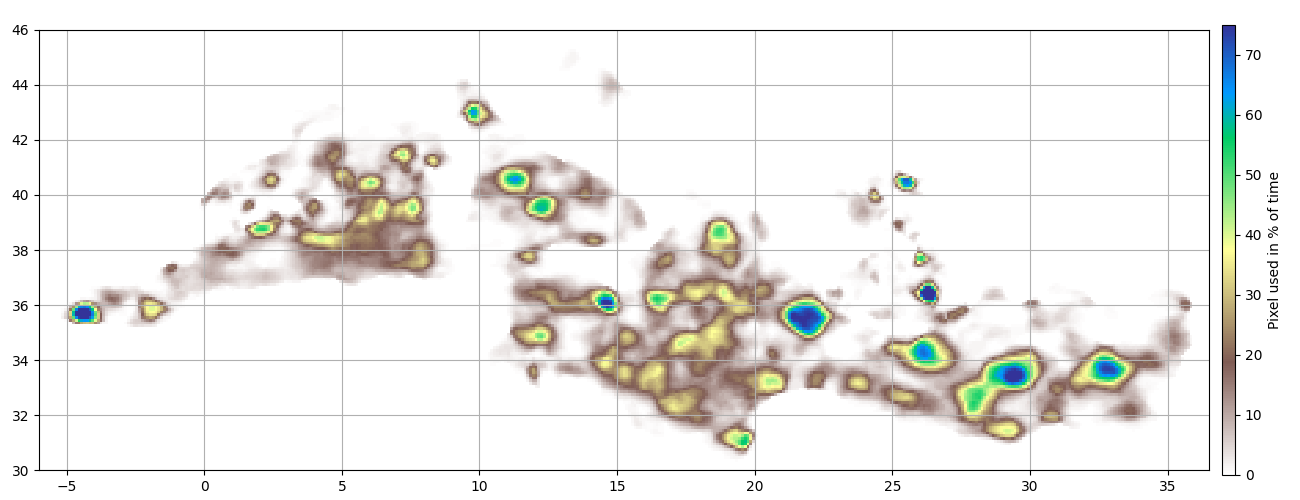
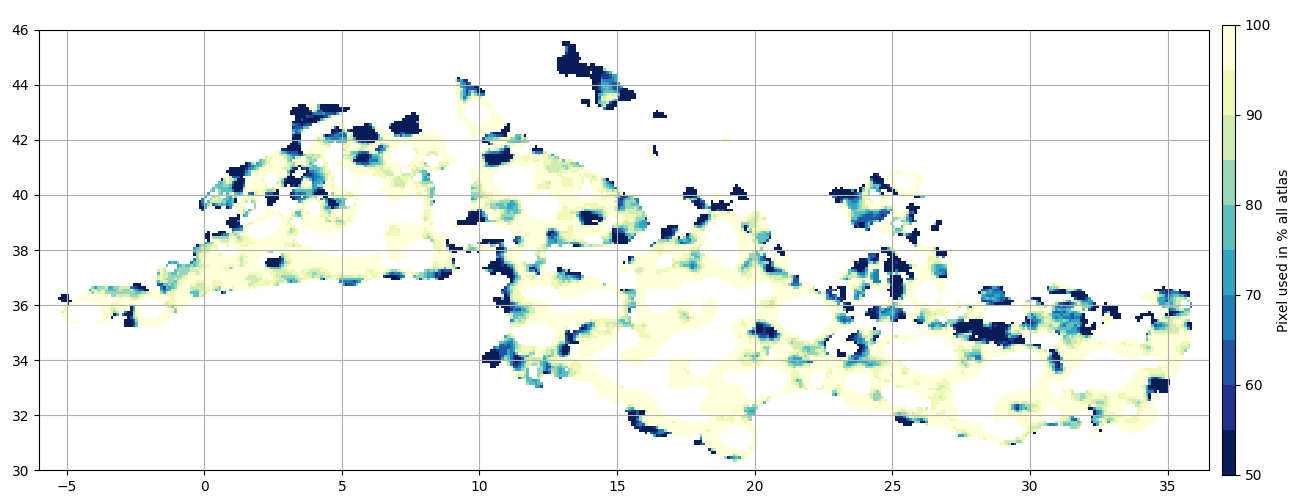
Network longer than 20 days
Display the % of time each pixel (1/10°) is within an anticyclonic network which total lifetime is longer than 20 days
ax = start_axes("")
n20 = n.longer_than(20)
g_20 = n20.grid_count(bins)
m = g_20.display(ax, **kw_time, vmin=0, vmax=75)
update_axes(ax, m).set_label("Pixel used in % of time")
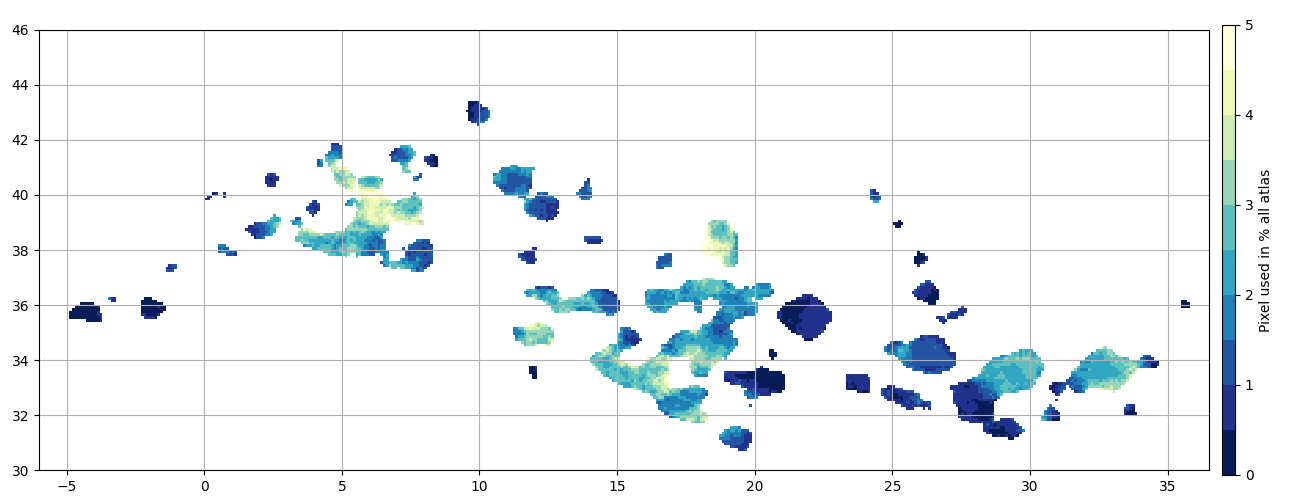
Ratio
Ratio between the longer and total presence
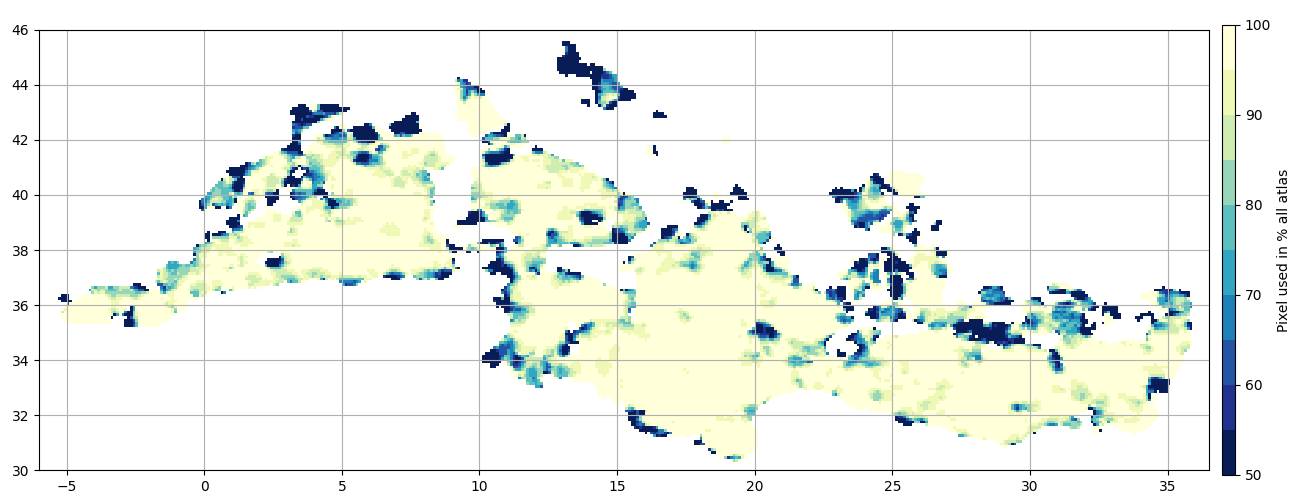
Now we will hide pixel which are used less than 365 times
g_ = ma.array(
    g_20.vars["count"] * 100.0 / g_all.vars["count"], mask=g_all.vars["count"] < 365
)
ax = start_axes("")
m = g_20.display(ax, **kw_ratio, vmin=50, vmax=100, name=g_)
update_axes(ax, m).set_label("Pixel used in % all atlas")
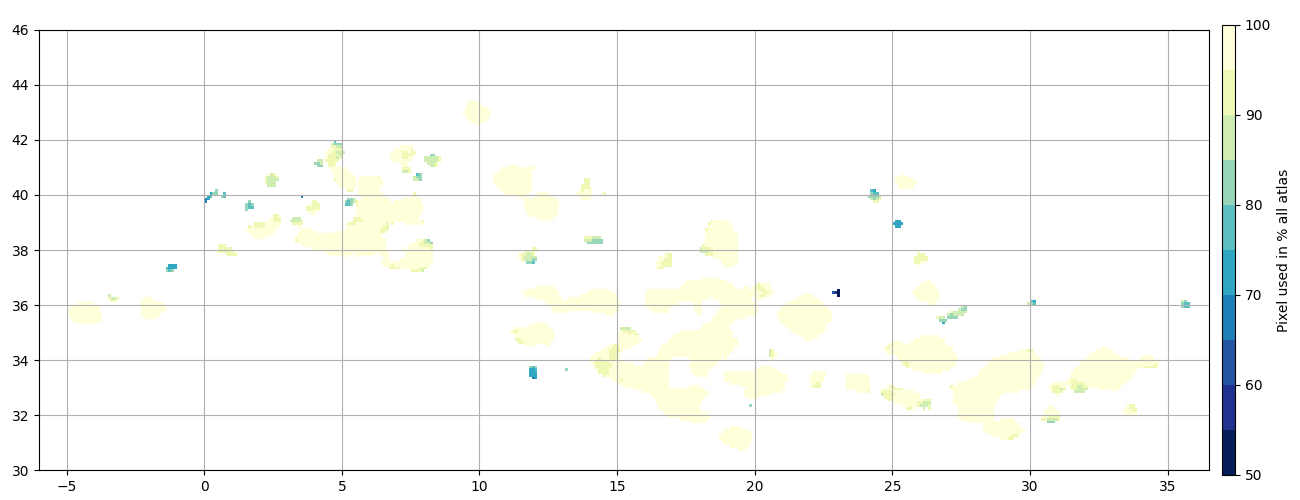
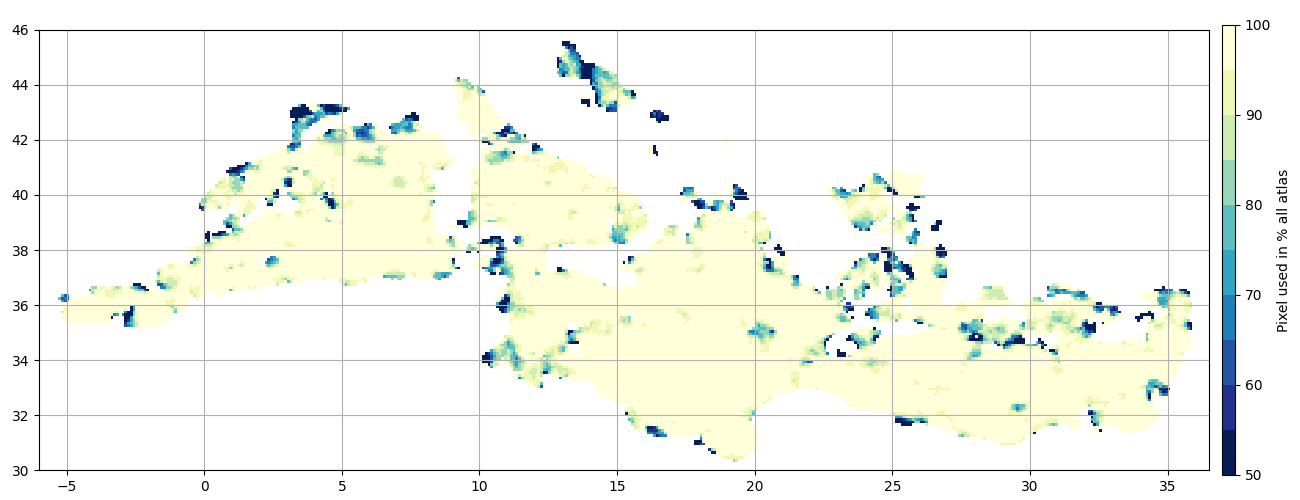
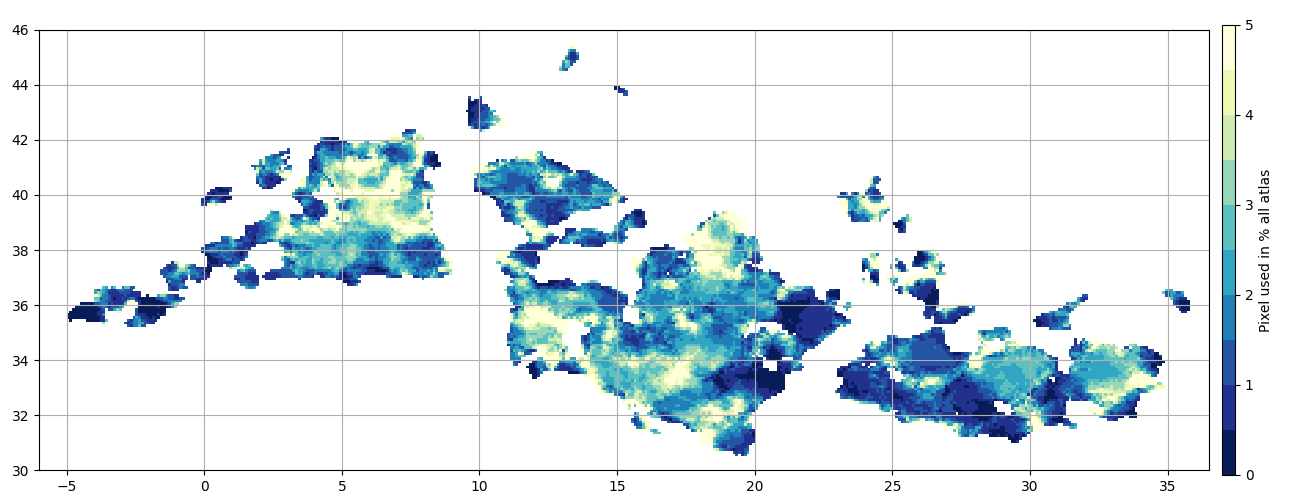
Now we will hide pixel which are used more than 365 times
ax = start_axes("")
g_ = ma.array(
    g_20.vars["count"] * 100.0 / g_all.vars["count"], mask=g_all.vars["count"] >= 365
)
m = g_20.display(ax, **kw_ratio, vmin=50, vmax=100, name=g_)
update_axes(ax, m).set_label("Pixel used in % all atlas")
Coastal areas are mostly populated by short networks
All merging
Display the occurence of merging events
ax = start_axes("")
g_all_merging = n.merging_event().grid_count(bins)
m = g_all_merging.display(ax, **kw_time, vmin=0, vmax=1)
update_axes(ax, m).set_label("Pixel used in % of time")
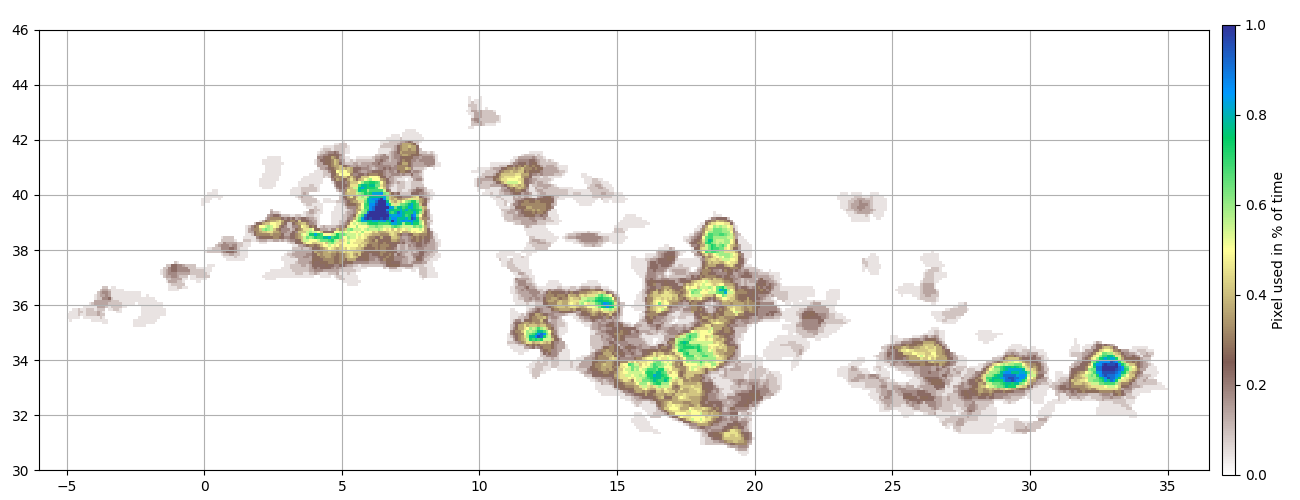
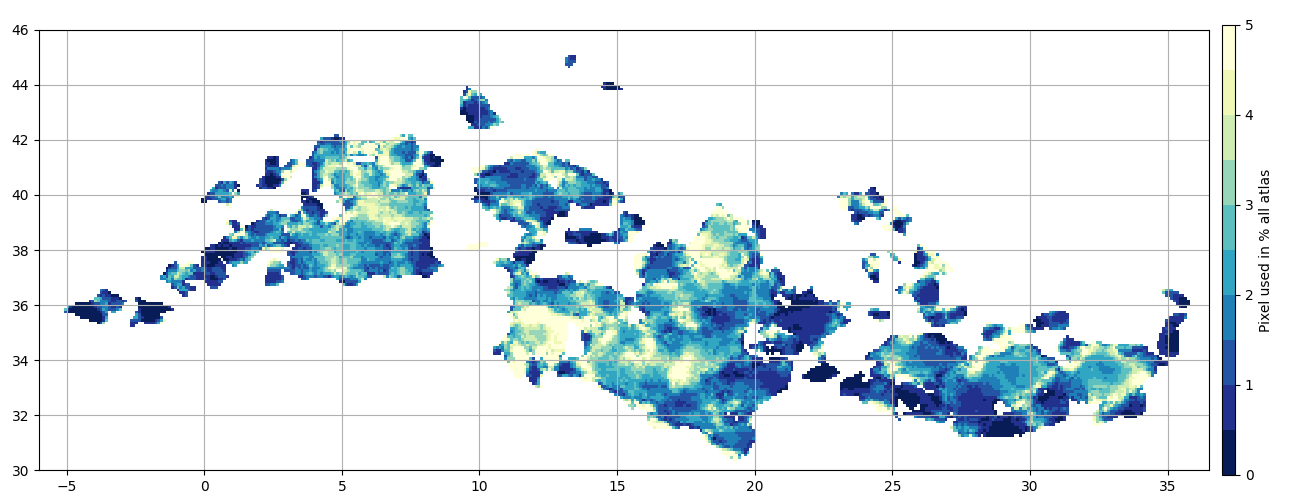
Ratio merging events / eddy presence
ax = start_axes("")
g_ = g_all_merging.vars["count"] * 100.0 / g_all.vars["count"]
m = g_all_merging.display(ax, **kw_ratio, vmin=0, vmax=5, name=g_)
update_axes(ax, m).set_label("Pixel used in % all atlas")
Merging in networks longer than 10 days, with dead end remove (shorter than 10 observations)
ax = start_axes("")
n10_ = n10.copy()
n10_.remove_dead_end(nobs=10)
merger = n10_.merging_event()
g_10_merging = merger.grid_count(bins)
m = g_10_merging.display(ax, **kw_time, vmin=0, vmax=1)
update_axes(ax, m).set_label("Pixel used in % of time")
Merging in networks longer than 10 days
ax = start_axes("")
merger = n10.merging_event()
g_10_merging = merger.grid_count(bins)
m = g_10_merging.display(ax, **kw_time, vmin=0, vmax=1)
update_axes(ax, m).set_label("Pixel used in % of time")

Ratio merging events / eddy presence
All splitting
Display the occurence of splitting events
ax = start_axes("")
g_all_splitting = n.splitting_event().grid_count(bins)
m = g_all_splitting.display(ax, **kw_time, vmin=0, vmax=1)
update_axes(ax, m).set_label("Pixel used in % of time")
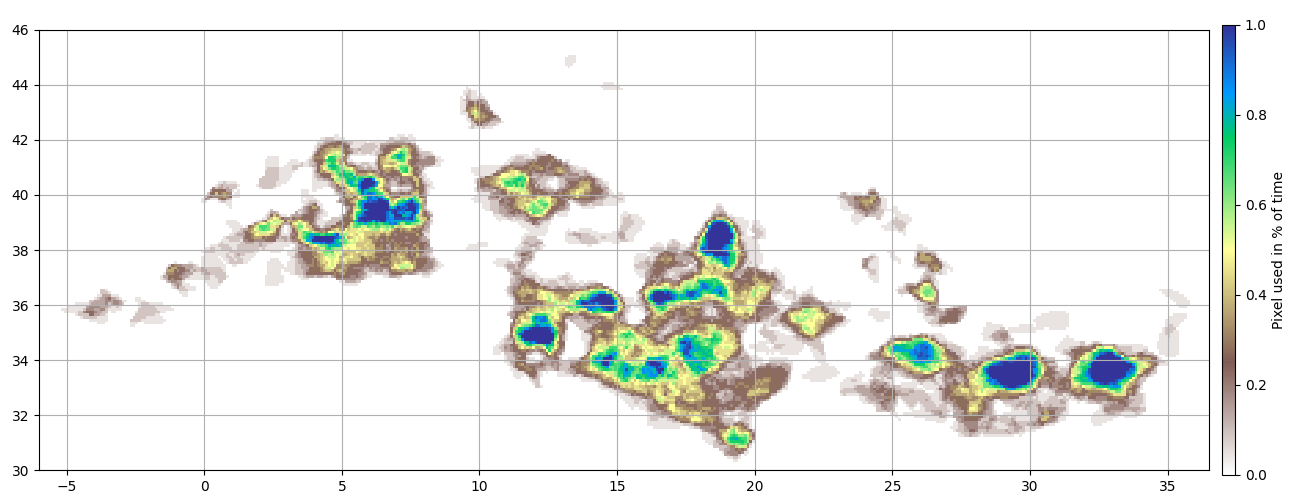
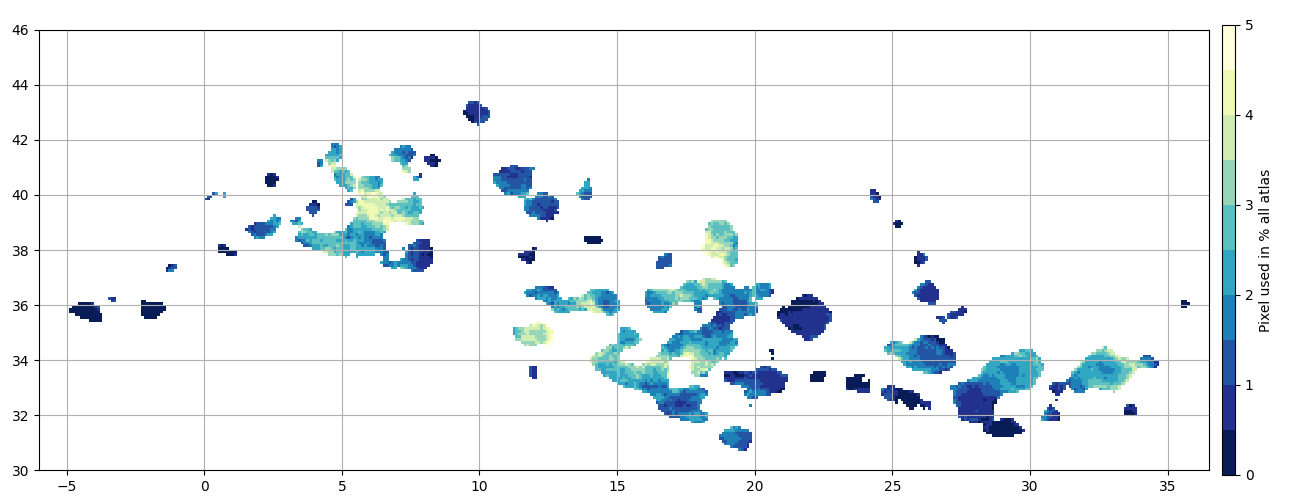
Ratio splitting events / eddy presence
ax = start_axes("")
g_ = g_all_splitting.vars["count"] * 100.0 / g_all.vars["count"]
m = g_all_splitting.display(ax, **kw_ratio, vmin=0, vmax=5, name=g_)
update_axes(ax, m).set_label("Pixel used in % all atlas")
splitting in networks longer than 10 days
ax = start_axes("")
g_10_splitting = n10.splitting_event().grid_count(bins)
m = g_10_splitting.display(ax, **kw_time, vmin=0, vmax=1)
update_axes(ax, m).set_label("Pixel used in % of time")

Total running time of the script: (0 minutes 3.867 seconds)