Note
Go to the end to download the full example code. or to run this example in your browser via Binder
Follow particle
import re
from matplotlib import colors, pyplot as plt
from matplotlib.animation import FuncAnimation
from numpy import arange, meshgrid, ones, unique, zeros
from py_eddy_tracker import start_logger
from py_eddy_tracker.appli.gui import Anim
from py_eddy_tracker.data import get_demo_path
from py_eddy_tracker.dataset.grid import GridCollection
from py_eddy_tracker.observations.groups import particle_candidate
from py_eddy_tracker.observations.network import NetworkObservations
start_logger().setLevel("ERROR")
class VideoAnimation(FuncAnimation):
def _repr_html_(self, *args, **kwargs):
"""To get video in html and have a player"""
content = self.to_html5_video()
return re.sub(
r'width="[0-9]*"\sheight="[0-9]*"', 'width="100%" height="100%"', content
)
def save(self, *args, **kwargs):
if args[0].endswith("gif"):
# In this case gif is used to create thumbnail which is not used but consume same time than video
# So we create an empty file, to save time
with open(args[0], "w") as _:
pass
return
return super().save(*args, **kwargs)
n = NetworkObservations.load_file(get_demo_path("network_med.nc")).network(651)
n = n.extract_with_mask((n.time >= 20180) * (n.time <= 20269))
n.remove_dead_end(nobs=0, ndays=10)
n = n.remove_trash()
n.numbering_segment()
c = GridCollection.from_netcdf_cube(
get_demo_path("dt_med_allsat_phy_l4_2005T2.nc"),
"longitude",
"latitude",
"time",
heigth="adt",
)
/home/docs/checkouts/readthedocs.org/user_builds/py-eddy-tracker/conda/latest/lib/python3.12/site-packages/numpy/ma/core.py:1020: RuntimeWarning: overflow encountered in multiply
result = self.f(da, db, *args, **kwargs)
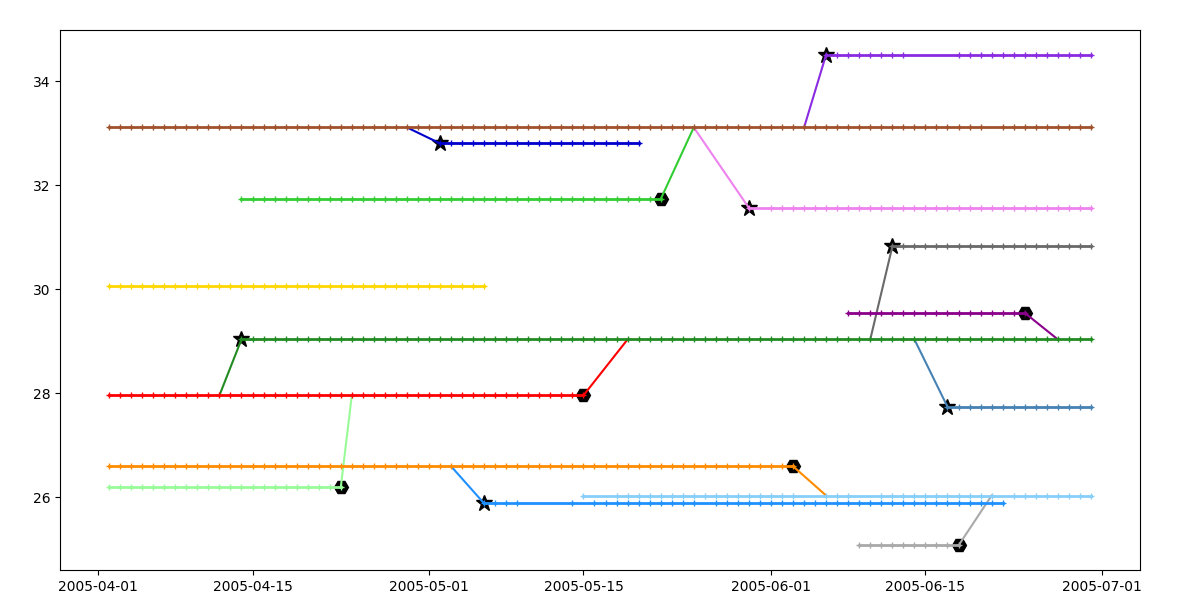
Schema
fig = plt.figure(figsize=(12, 6))
ax = fig.add_axes([0.05, 0.05, 0.9, 0.9])
_ = n.display_timeline(ax, field="longitude", marker="+", lw=2, markersize=5)
Animation
Particle settings
t_snapshot = 20200
step = 1 / 50.0
x, y = meshgrid(arange(20, 36, step), arange(30, 46, step))
N = 6
x_f, y_f = x[::N, ::N].copy(), y[::N, ::N].copy()
x, y = x.reshape(-1), y.reshape(-1)
x_f, y_f = x_f.reshape(-1), y_f.reshape(-1)
n_ = n.extract_with_mask(n.time == t_snapshot)
index = n_.contains(x, y, intern=True)
m = index != -1
index = n_.segment[index[m]]
index_ = unique(index)
x, y = x[m], y[m]
m = ~n_.inside(x_f, y_f, intern=True)
x_f, y_f = x_f[m], y_f[m]
Animation
cmap = colors.ListedColormap(list(n.COLORS), name="from_list", N=n.segment.max() + 1)
a = Anim(
n,
intern=False,
figsize=(12, 6),
nb_step=1,
dpi=60,
field_color="segment",
field_txt="segment",
cmap=cmap,
)
a.fig.suptitle(""), a.ax.set_xlim(24, 36), a.ax.set_ylim(30, 36)
a.txt.set_position((25, 31))
step = 0.25
kw_p = dict(
nb_step=2,
time_step=86400 * step * 0.5,
t_init=t_snapshot - 2 * step,
u_name="u",
v_name="v",
)
mappables = dict()
particules = c.advect(x, y, **kw_p)
filament = c.filament(x_f, y_f, **kw_p, filament_size=3)
kw = dict(ls="", marker=".", markersize=0.25)
for k in index_:
m = k == index
mappables[k] = a.ax.plot([], [], color=cmap(k), **kw)[0]
m_filament = a.ax.plot([], [], lw=0.25, color="gray")[0]
def update(frame):
tt, xt, yt = particules.__next__()
for k, mappable in mappables.items():
m = index == k
mappable.set_data(xt[m], yt[m])
tt, xt, yt = filament.__next__()
m_filament.set_data(xt, yt)
if frame % 1 == 0:
a.func_animation(frame)
ani = VideoAnimation(a.fig, update, frames=arange(20200, 20269, step), interval=200)
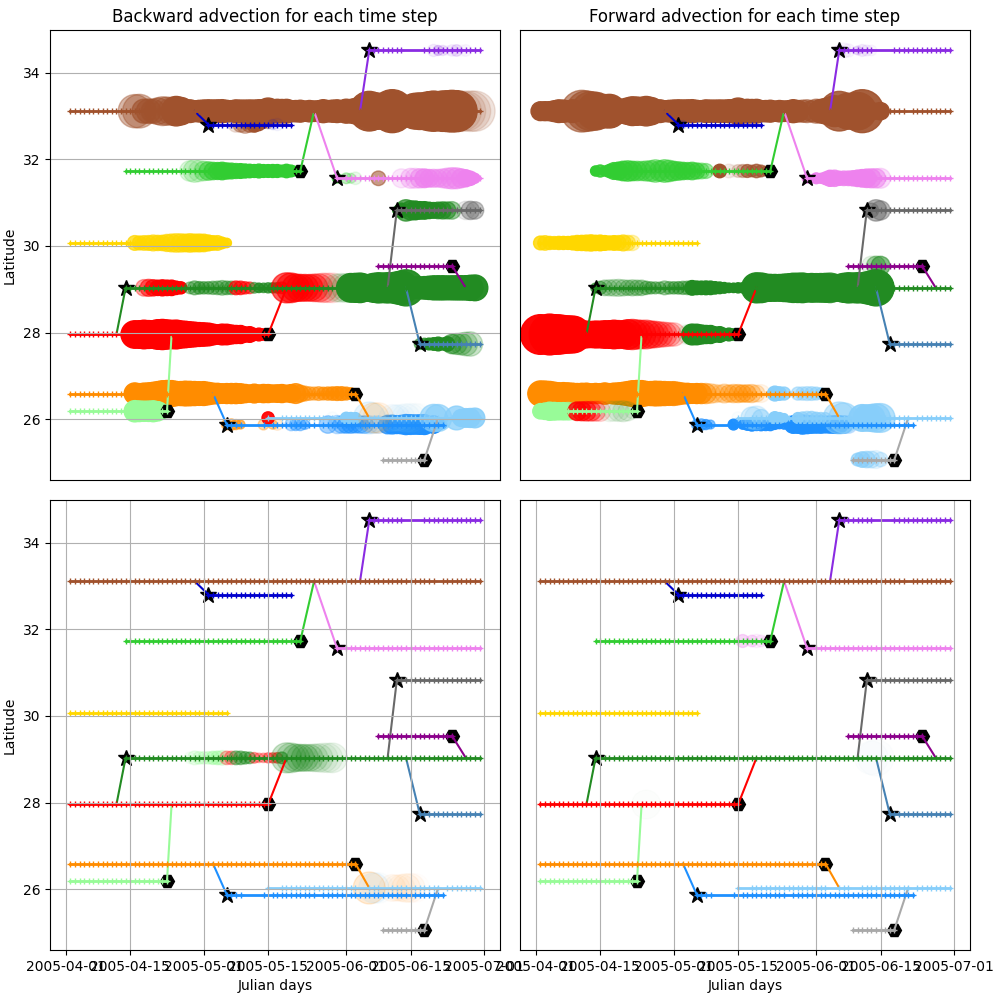
Particle advection
Advection from speed contour to speed contour (default)
step = 1 / 60.0
t_start, t_end = int(n.period[0]), int(n.period[1])
dt = 14
shape = (n.obs.size, 2)
# Forward run
i_target_f, pct_target_f = -ones(shape, dtype="i4"), zeros(shape, dtype="i1")
for t in arange(t_start, t_end - dt):
particle_candidate(c, n, step, t, i_target_f, pct_target_f, n_days=dt)
# Backward run
i_target_b, pct_target_b = -ones(shape, dtype="i4"), zeros(shape, dtype="i1")
for t in arange(t_start + dt, t_end):
particle_candidate(c, n, step, t, i_target_b, pct_target_b, n_days=-dt)
/home/docs/checkouts/readthedocs.org/user_builds/py-eddy-tracker/conda/latest/lib/python3.12/site-packages/numpy/ma/core.py:4365: RuntimeWarning: invalid value encountered in multiply
self._data.__imul__(other_data)
/home/docs/checkouts/readthedocs.org/user_builds/py-eddy-tracker/conda/latest/lib/python3.12/site-packages/numpy/ma/core.py:4365: RuntimeWarning: invalid value encountered in multiply
self._data.__imul__(other_data)
fig = plt.figure(figsize=(10, 10))
ax_1st_b = fig.add_axes([0.05, 0.52, 0.45, 0.45])
ax_2nd_b = fig.add_axes([0.05, 0.05, 0.45, 0.45])
ax_1st_f = fig.add_axes([0.52, 0.52, 0.45, 0.45])
ax_2nd_f = fig.add_axes([0.52, 0.05, 0.45, 0.45])
ax_1st_b.set_title("Backward advection for each time step")
ax_1st_f.set_title("Forward advection for each time step")
ax_1st_b.set_ylabel("Color -> First target\nLatitude")
ax_2nd_b.set_ylabel("Color -> Secondary target\nLatitude")
ax_2nd_b.set_xlabel("Julian days"), ax_2nd_f.set_xlabel("Julian days")
ax_1st_f.set_yticks([]), ax_2nd_f.set_yticks([])
ax_1st_f.set_xticks([]), ax_1st_b.set_xticks([])
def color_alpha(target, pct, vmin=5, vmax=80):
color = cmap(n.segment[target])
# We will hide under 5 % and from 80% to 100 % it will be 1
alpha = (pct - vmin) / (vmax - vmin)
alpha[alpha < 0] = 0
alpha[alpha > 1] = 1
color[:, 3] = alpha
return color
kw = dict(
name=None, yfield="longitude", event=False, zorder=-100, s=(n.speed_area / 20e6)
)
n.scatter_timeline(ax_1st_b, c=color_alpha(i_target_b.T[0], pct_target_b.T[0]), **kw)
n.scatter_timeline(ax_2nd_b, c=color_alpha(i_target_b.T[1], pct_target_b.T[1]), **kw)
n.scatter_timeline(ax_1st_f, c=color_alpha(i_target_f.T[0], pct_target_f.T[0]), **kw)
n.scatter_timeline(ax_2nd_f, c=color_alpha(i_target_f.T[1], pct_target_f.T[1]), **kw)
for ax in (ax_1st_b, ax_2nd_b, ax_1st_f, ax_2nd_f):
n.display_timeline(ax, field="longitude", marker="+", lw=2, markersize=5)
ax.grid()
Total running time of the script: (0 minutes 23.082 seconds)