Note
Go to the end to download the full example code. or to run this example in your browser via Binder
Network segmentation process
# sphinx_gallery_thumbnail_number = 2
import re

from matplotlib import pyplot as plt
from matplotlib.animation import FuncAnimation
from matplotlib.colors import ListedColormap
from numpy import ones, where

from py_eddy_tracker.data import get_demo_path
from py_eddy_tracker.gui import GUI_AXES
from py_eddy_tracker.observations.network import NetworkObservations
from py_eddy_tracker.observations.tracking import TrackEddiesObservations
class VideoAnimation(FuncAnimation):
    def _repr_html_(self, *args, **kwargs):
        """To get video in html and have a player"""
        content = self.to_html5_video()
        return re.sub(
            r'width="[0-9]*"\sheight="[0-9]*"', 'width="100%" height="100%"', content
        )

    def save(self, *args, **kwargs):
        if args[0].endswith("gif"):
            # In this case gif is used to create thumbnail which is not used but consume same time than video
            # So we create an empty file, to save time
            with open(args[0], "w") as _:
                pass
            return
        return super().save(*args, **kwargs)


def get_obs(dataset):
    "Function to isolate a specific obs"
    return where(
        (dataset.lat > 33)
        * (dataset.lat < 34)
        * (dataset.lon > 22)
        * (dataset.lon < 23)
        * (dataset.time > 20630)
        * (dataset.time < 20650)
    )[0][0]
Hack to pick up each step of segmentation
TRACKS = list()
INDICES = list()


class MyTrack(TrackEddiesObservations):
    @staticmethod
    def get_next_obs(i_current, ids, x, y, time_s, time_e, time_ref, window, **kwargs):
        TRACKS.append(ids["track"].copy())
        INDICES.append(i_current)
        return TrackEddiesObservations.get_next_obs(
            i_current, ids, x, y, time_s, time_e, time_ref, window, **kwargs
        )
Load data
Load data where observations are put in same network but no segmentation
# Get a known network for the demonstration
n = NetworkObservations.load_file(get_demo_path("network_med.nc")).network(651)
# We keep only some segment
n = n.relative(get_obs(n), order=2)
print(len(n))
# We convert and order object like segmentation was never happen on observations
e = n.astype(MyTrack)
e.obs.sort(order=("track", "time"), kind="stable")
1580
Do segmentation
Segmentation based on maximum overlap, temporal window for candidates = 5 days
matrix = e.split_network(intern=False, window=5)
Anim
def update(i_frame):
    tr = TRACKS[i_frame]
    mappable_tracks.set_array(tr)
    s = 40 * ones(tr.shape)
    s[tr == 0] = 4
    mappable_tracks.set_sizes(s)

    indices_frames = INDICES[i_frame]
    mappable_CONTOUR.set_data(
        e.contour_lon_e[indices_frames], e.contour_lat_e[indices_frames]
    )
    mappable_CONTOUR.set_color(cmap.colors[tr[indices_frames] % len(cmap.colors)])
    return (mappable_tracks,)


fig = plt.figure(figsize=(16, 9), dpi=60)
ax = fig.add_axes([0.04, 0.06, 0.94, 0.88], projection=GUI_AXES)
ax.set_title(f"{len(e)} observations to segment")
ax.set_xlim(19, 29), ax.set_ylim(31, 35.5), ax.grid()
vmax = TRACKS[-1].max()
cmap = ListedColormap(["gray", *e.COLORS[:-1]], name="from_list", N=vmax)
mappable_tracks = ax.scatter(
    e.lon, e.lat, c=TRACKS[0], cmap=cmap, vmin=0, vmax=vmax, s=20
)
mappable_CONTOUR = ax.plot(
    e.contour_lon_e[INDICES[0]], e.contour_lat_e[INDICES[0]], color=cmap.colors[0]
)[0]
ani = VideoAnimation(fig, update, frames=range(1, len(TRACKS), 4), interval=125)
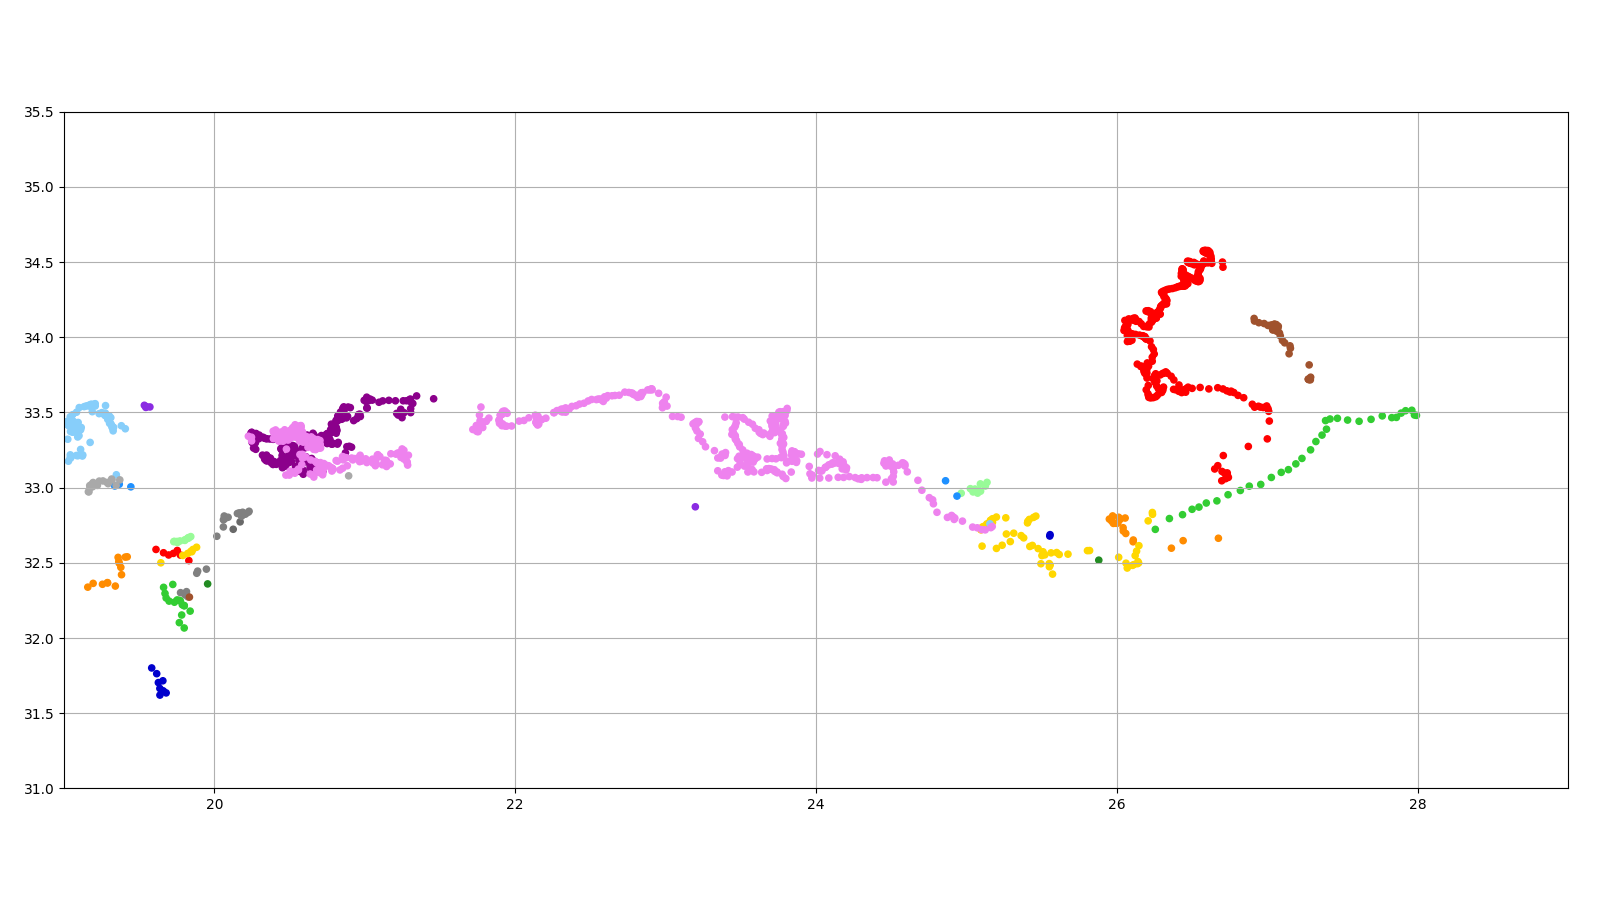
Final Result
fig = plt.figure(figsize=(16, 9))
ax = fig.add_axes([0.04, 0.06, 0.94, 0.88], projection=GUI_AXES)
ax.set_xlim(19, 29), ax.set_ylim(31, 35.5), ax.grid()
_ = ax.scatter(e.lon, e.lat, c=TRACKS[-1], cmap=cmap, vmin=0, vmax=vmax, s=20)
Total running time of the script: (0 minutes 23.851 seconds)