Note
Go to the end to download the full example code. or to run this example in your browser via Binder
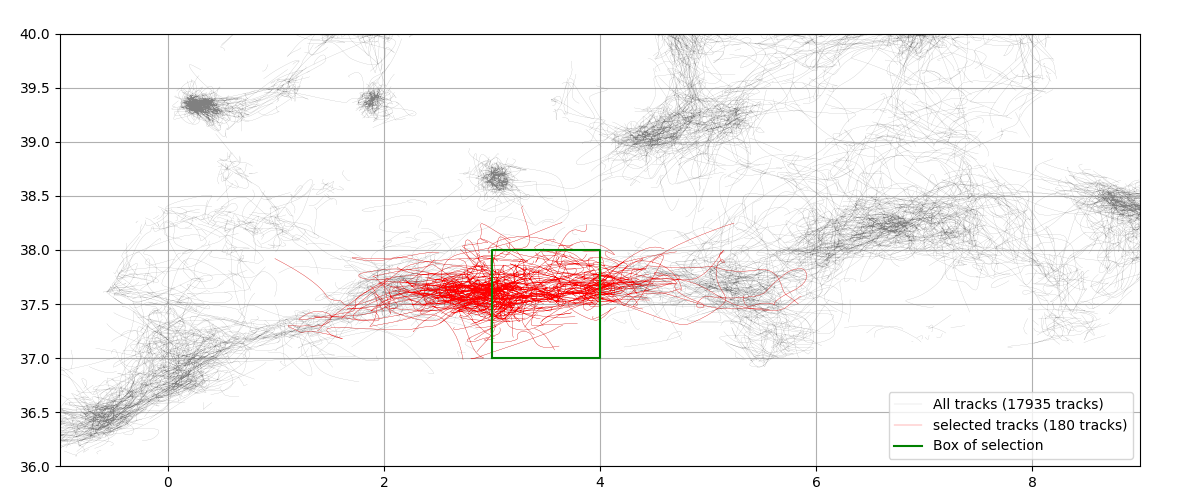
Tracks which go through area
from matplotlib import pyplot as plt
import py_eddy_tracker_sample

from py_eddy_tracker.observations.tracking import TrackEddiesObservations
Load experimental atlas, we filter position to have nice display
c = TrackEddiesObservations.load_file(
    py_eddy_tracker_sample.get_demo_path("eddies_med_adt_allsat_dt2018/Cyclonic.zarr")
)
c.position_filter(median_half_window=1, loess_half_window=5)
We extract eddies in the area set below, but we ask to keep full_path
Plot
fig = plt.figure(figsize=(12, 5))
ax = fig.add_axes((0.05, 0.05, 0.9, 0.9))
ax.set_xlim(-1, 9)
ax.set_ylim(36, 40)
ax.set_aspect("equal")
ax.grid()
c.plot(ax, color="gray", lw=0.1, ref=-10, label="All tracks ({nb_tracks} tracks)")
c_subset.plot(
    ax, color="red", lw=0.2, ref=-10, label="selected tracks ({nb_tracks} tracks)"
)
ax.plot(
    (x0, x0, x1, x1, x0),
    (y0, y1, y1, y0, y0),
    color="green",
    lw=1.5,
    label="Box of selection",
)
ax.legend()
<matplotlib.legend.Legend object at 0x7490346ef680>
Total running time of the script: (0 minutes 3.145 seconds)