Note
Go to the end to download the full example code. or to run this example in your browser via Binder
Display fields
from matplotlib import pyplot as plt
import py_eddy_tracker_sample

from py_eddy_tracker.observations.tracking import TrackEddiesObservations
Load an experimental cyclonic atlas, we keep only eddies which are follow more than 180 days
c = TrackEddiesObservations.load_file(
    py_eddy_tracker_sample.get_demo_path("eddies_med_adt_allsat_dt2018/Cyclonic.zarr")
)
c = c.extract_with_length((180, -1))
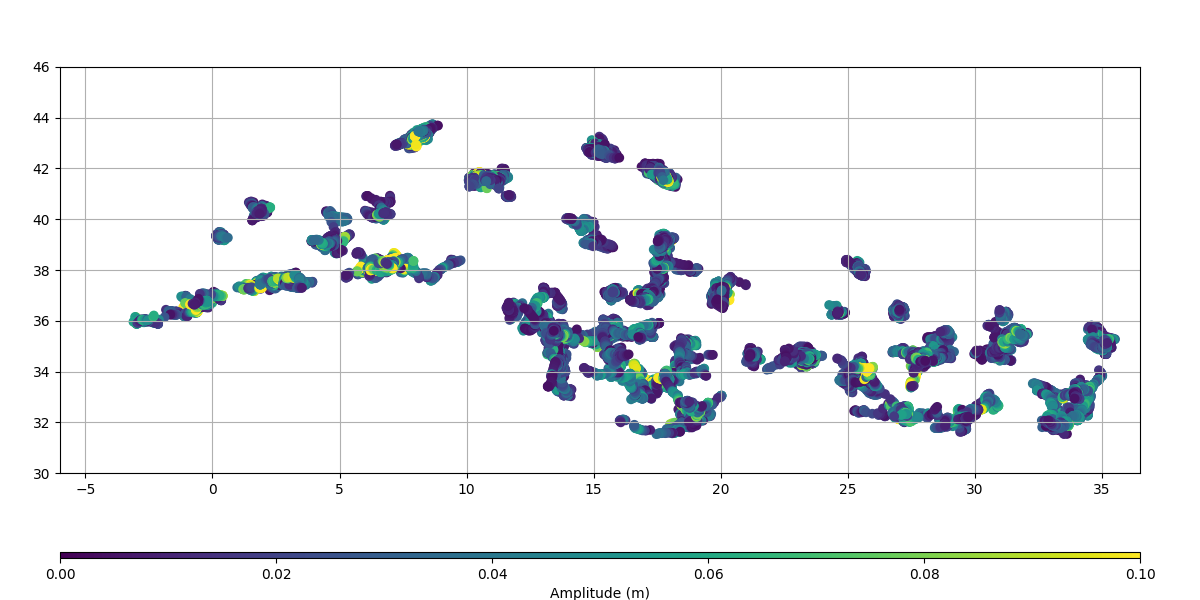
Plot amplitude field
fig = plt.figure(figsize=(12, 6))
ax = fig.add_axes((0.05, 0.1, 0.9, 0.9))
ax.set_aspect("equal")
ax.set_xlim(-6, 36.5), ax.set_ylim(30, 46)
m = c.scatter(ax, "amplitude", ref=-10, vmin=0, vmax=0.1)
ax.grid()

cb = plt.colorbar(
    m, cax=fig.add_axes([0.05, 0.07, 0.9, 0.01]), orientation="horizontal"
)
cb.set_label("Amplitude (m)")
Total running time of the script: (0 minutes 1.144 seconds)