Note
Go to the end to download the full example code. or to run this example in your browser via Binder
One Track
from matplotlib import pyplot as plt
import py_eddy_tracker_sample

from py_eddy_tracker.observations.tracking import TrackEddiesObservations
Load experimental atlas, and we select one eddy
a = TrackEddiesObservations.load_file(
    py_eddy_tracker_sample.get_demo_path(
        "eddies_med_adt_allsat_dt2018/Anticyclonic.zarr"
    )
)
eddy = a.extract_ids([9672])
eddy_f = a.extract_ids([9672])
eddy_f.position_filter(median_half_window=1, loess_half_window=5)
plot
fig = plt.figure(figsize=(12, 5))
ax = fig.add_axes((0.05, 0.05, 0.9, 0.9))
ax.set_xlim(17.5, 22)
ax.set_ylim(35, 36.5)
ax.set_aspect("equal")
ax.grid()
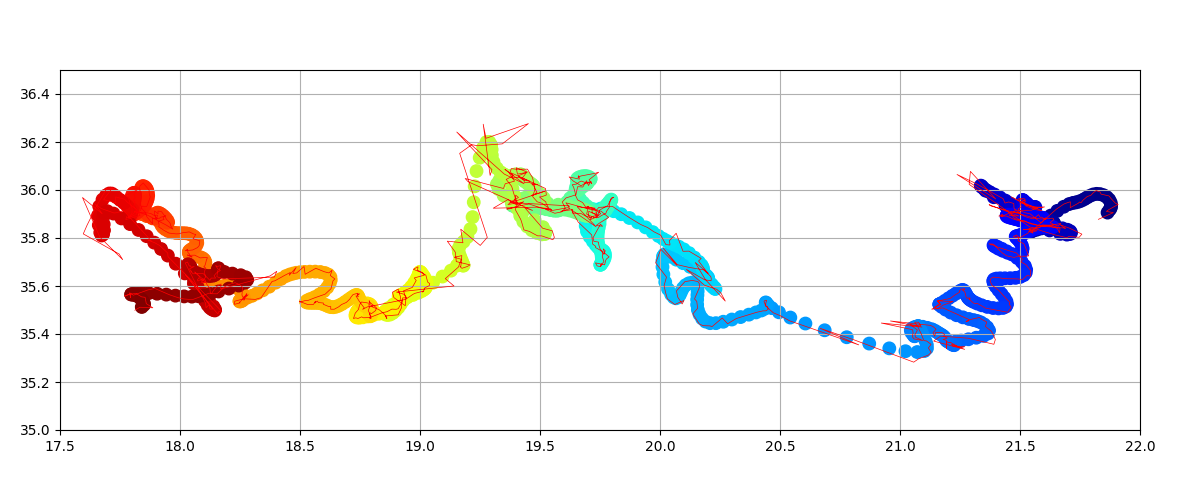
eddy.plot(ax, color="r", lw=0.5)
eddy_f.scatter(ax, "n", cmap="jet", s=80)
<matplotlib.collections.PathCollection object at 0x74903c64a450>
fig = plt.figure(figsize=(12, 5))
ax = fig.add_axes((0.05, 0.05, 0.9, 0.9))
ax.set_xlim(17, 23)
ax.set_ylim(34.5, 37)
ax.set_aspect("equal")
ax.grid()
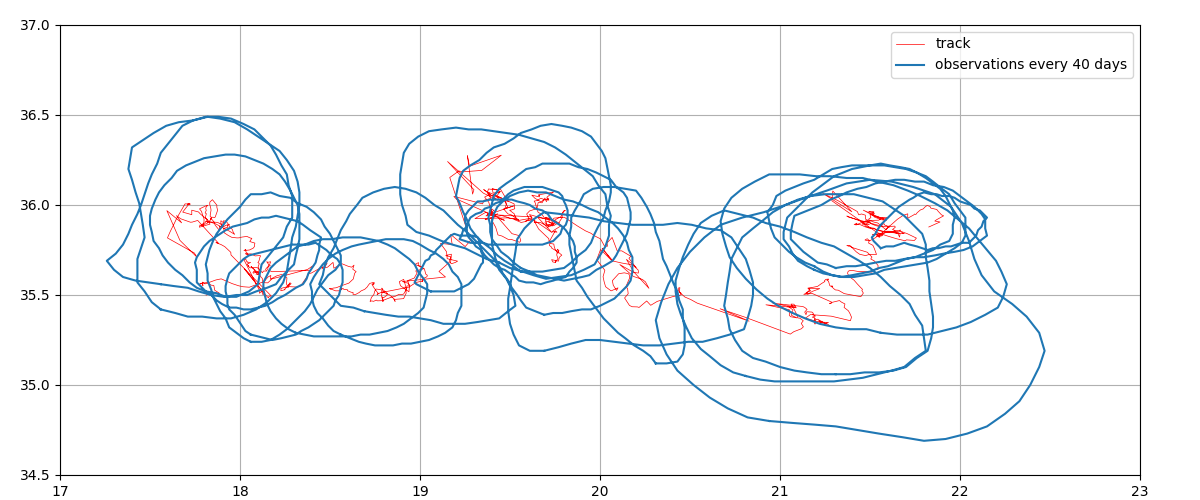
eddy.plot(ax, color="r", lw=0.5, label="track")
eddy.index(range(0, len(eddy), 40)).display(
ax, intern_only=True, label="observations every 40 days"
)
ax.legend()
<matplotlib.legend.Legend object at 0x7490348939b0>
Total running time of the script: (0 minutes 0.662 seconds)