Note
Go to the end to download the full example code. or to run this example in your browser via Binder
Get mean of grid in each eddies
from matplotlib import pyplot as plt

from py_eddy_tracker import data
from py_eddy_tracker.dataset.grid import RegularGridDataset
from py_eddy_tracker.observations.observation import EddiesObservations
def start_axes(title):
    fig = plt.figure(figsize=(13, 5))
    ax = fig.add_axes([0.03, 0.03, 0.90, 0.94])
    ax.set_xlim(-6, 36.5), ax.set_ylim(30, 46)
    ax.set_aspect("equal")
    ax.set_title(title)
    return ax


def update_axes(ax, mappable=None):
    ax.grid()
    ax.legend()
    if mappable:
        plt.colorbar(mappable, cax=ax.figure.add_axes([0.95, 0.05, 0.01, 0.9]))
Load detection files and data to interp
a = EddiesObservations.load_file(data.get_demo_path("Anticyclonic_20160515.nc"))
c = EddiesObservations.load_file(data.get_demo_path("Cyclonic_20160515.nc"))

aviso_map = RegularGridDataset(
    data.get_demo_path("dt_med_allsat_phy_l4_20160515_20190101.nc"),
    "longitude",
    "latitude",
)
aviso_map.add_uv("adt")
File was created with py-eddy-tracker version 'None' but software version is '0.0'
File was created with py-eddy-tracker version 'None' but software version is '0.0'
We assume pixel position of grid is centered for /home/docs/checkouts/readthedocs.org/user_builds/py-eddy-tracker/conda/latest/lib/python3.12/site-packages/py_eddy_tracker/data/dt_med_allsat_phy_l4_20160515_20190101.nc
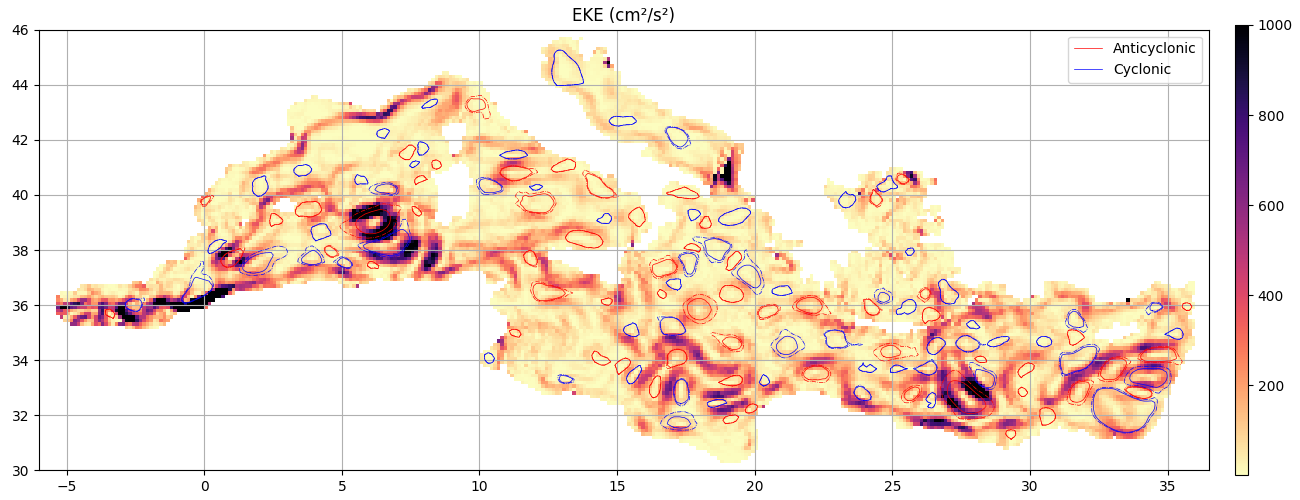
Compute and store eke in cm²/s²
aviso_map.add_grid(
    "eke", (aviso_map.grid("u") ** 2 + aviso_map.grid("v") ** 2) * 0.5 * (100**2)
)

eke_kwargs = dict(vmin=1, vmax=1000, cmap="magma_r")

ax = start_axes("EKE (cm²/s²)")
m = aviso_map.display(ax, "eke", **eke_kwargs)
a.display(ax, color="r", linewidth=0.5, label="Anticyclonic", ref=-10)
c.display(ax, color="b", linewidth=0.5, label="Cyclonic", ref=-10)
update_axes(ax, m)
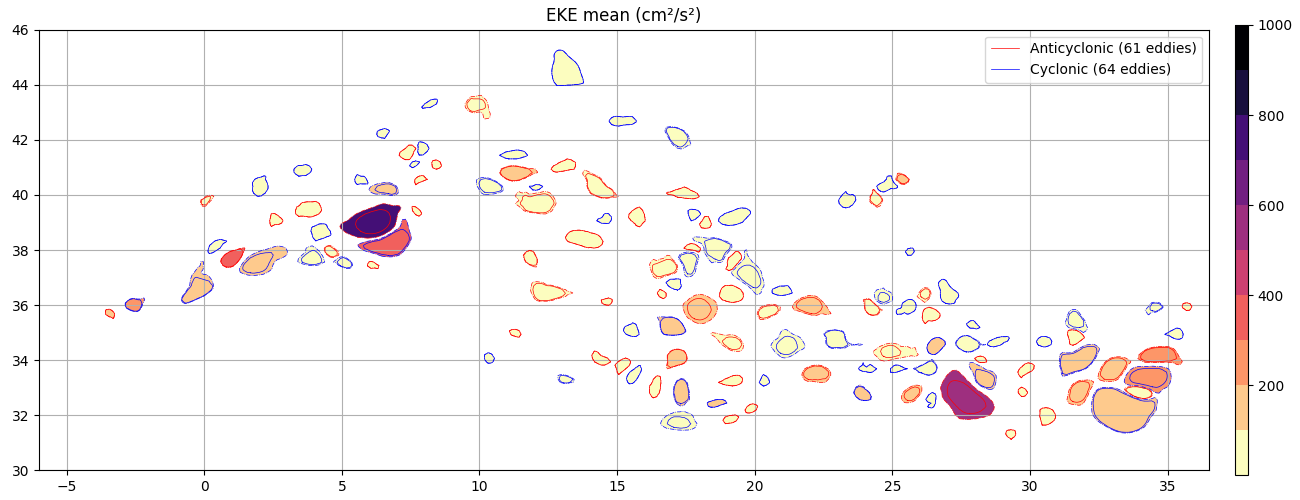
Get mean of eke in each effective contour
ax = start_axes("EKE mean (cm²/s²)")
a.display(ax, color="r", linewidth=0.5, label="Anticyclonic ({nb_obs} eddies)", ref=-10)
c.display(ax, color="b", linewidth=0.5, label="Cyclonic ({nb_obs} eddies)", ref=-10)
eke = a.interp_grid(aviso_map, "eke", method="mean", intern=False)
a.filled(ax, eke, ref=-10, **eke_kwargs)
eke = c.interp_grid(aviso_map, "eke", method="mean", intern=False)
m = c.filled(ax, eke, ref=-10, **eke_kwargs)
update_axes(ax, m)
Total running time of the script: (0 minutes 3.510 seconds)