Note
Go to the end to download the full example code. or to run this example in your browser via Binder
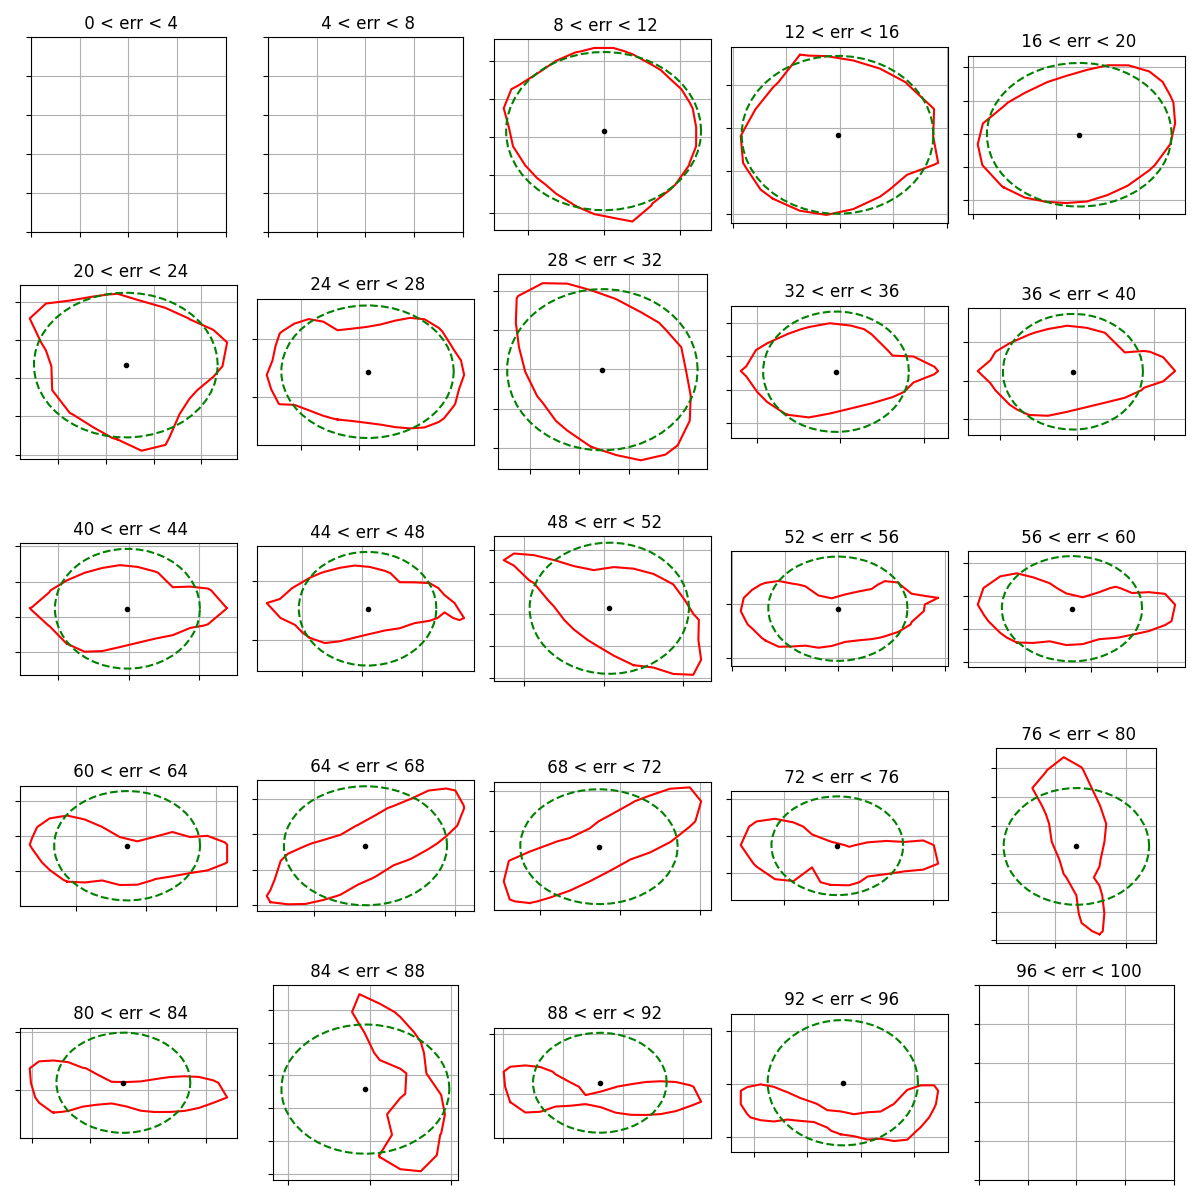
Shape error gallery
Gallery of contours with shape error
from matplotlib import pyplot as plt
from numpy import arange, cos, linspace, radians, sin

from py_eddy_tracker import data
from py_eddy_tracker.dataset.grid import RegularGridDataset
from py_eddy_tracker.eddy_feature import Contours
from py_eddy_tracker.generic import local_to_coordinates
Method to built circle from center coordinates
We iterate over closed contours and sort with regards of shape error
g = RegularGridDataset(
    data.get_demo_path("dt_med_allsat_phy_l4_20160515_20190101.nc"),
    "longitude",
    "latitude",
)
c = Contours(g.x_c, g.y_c, g.grid("adt") * 100, arange(-50, 50, 0.2))
contours = dict()
for coll in c.iter():
    for current_contour in coll.get_paths():
        _, _, _, aerr = current_contour.fit_circle()
        i = int(aerr // 4) + 1
        if i not in contours:
            contours[i] = list()
        contours[i].append(current_contour)
We assume pixel position of grid is centered for /home/docs/checkouts/readthedocs.org/user_builds/py-eddy-tracker/conda/latest/lib/python3.12/site-packages/py_eddy_tracker/data/dt_med_allsat_phy_l4_20160515_20190101.nc
Shape error gallery
For each contour display, we display circle fitted, we work at different latitude circle could have distorsion
fig = plt.figure(figsize=(12, 12))
for i in range(1, 26):
    e_min, e_max = (i - 1) * 4, i * 4
    ax = plt.subplot(5, 5, i, title=f" {e_min} < err < {e_max}")
    ax.xaxis.set_ticklabels([])
    ax.yaxis.set_ticklabels([])
    ax.set_aspect("equal")
    ax.grid()
    if i in contours:
        for contour in contours[i]:
            x, y = contour.lon, contour.lat
            x0, y0, radius, _ = contour.fit_circle()
            if x.shape[0] > 30 and 30000 < radius < 70000:
                # Plot only first contour found
                m = ax.plot(x, y, "r")[0]
                ax.plot(*build_circle(x0, y0, radius), "g--")
                ax.plot(x0, y0, "k.")
                break
plt.tight_layout()
Total running time of the script: (0 minutes 7.848 seconds)