Note
Go to the end to download the full example code or to run this example in your browser via Binder
Eddy detection and filter
from datetime import datetime

from matplotlib import pyplot as plt
from numpy import arange

from py_eddy_tracker import data
from py_eddy_tracker.dataset.grid import RegularGridDataset
def start_axes(title):
    fig = plt.figure(figsize=(13, 5))
    ax = fig.add_axes([0.03, 0.03, 0.90, 0.94])
    ax.set_xlim(-6, 36.5), ax.set_ylim(30, 46)
    ax.set_aspect("equal")
    ax.set_title(title, weight="bold")
    return ax


def update_axes(ax, mappable=None):
    ax.grid()
    if mappable:
        plt.colorbar(mappable, cax=ax.figure.add_axes([0.94, 0.05, 0.01, 0.9]))
Load Input grid, ADT is used to detect eddies. Add a new filed to store the high-pass filtered ADT
g = RegularGridDataset(
    data.get_demo_path("dt_med_allsat_phy_l4_20160515_20190101.nc"),
    "longitude",
    "latitude",
)
g.add_uv("adt")
g.copy("adt", "adt_high")
wavelength = 800
g.bessel_high_filter("adt_high", wavelength)
date = datetime(2016, 5, 15)
/home/docs/checkouts/readthedocs.org/user_builds/py-eddy-tracker/conda/latest/lib/python3.10/site-packages/numpy-1.24.3-py3.10-linux-x86_64.egg/numpy/ma/core.py:1020: RuntimeWarning: overflow encountered in multiply
  result = self.f(da, db, *args, **kwargs)
Run the detection for the total grid and the filtered grid
a_filtered, c_filtered = g.eddy_identification("adt_high", "u", "v", date, 0.002)
merge_f = a_filtered.merge(c_filtered)
a_tot, c_tot = g.eddy_identification("adt", "u", "v", date, 0.002)
merge_t = a_tot.merge(c_tot)
/home/docs/checkouts/readthedocs.org/user_builds/py-eddy-tracker/conda/latest/lib/python3.10/site-packages/numpy-1.24.3-py3.10-linux-x86_64.egg/numpy/ma/core.py:6957: RuntimeWarning: overflow encountered in power
  result = np.where(m, fa, umath.power(fa, fb)).view(basetype)
/home/docs/checkouts/readthedocs.org/user_builds/py-eddy-tracker/conda/latest/lib/python3.10/site-packages/numpy-1.24.3-py3.10-linux-x86_64.egg/numpy/lib/function_base.py:4737: UserWarning: Warning: 'partition' will ignore the 'mask' of the MaskedArray.
  arr.partition(
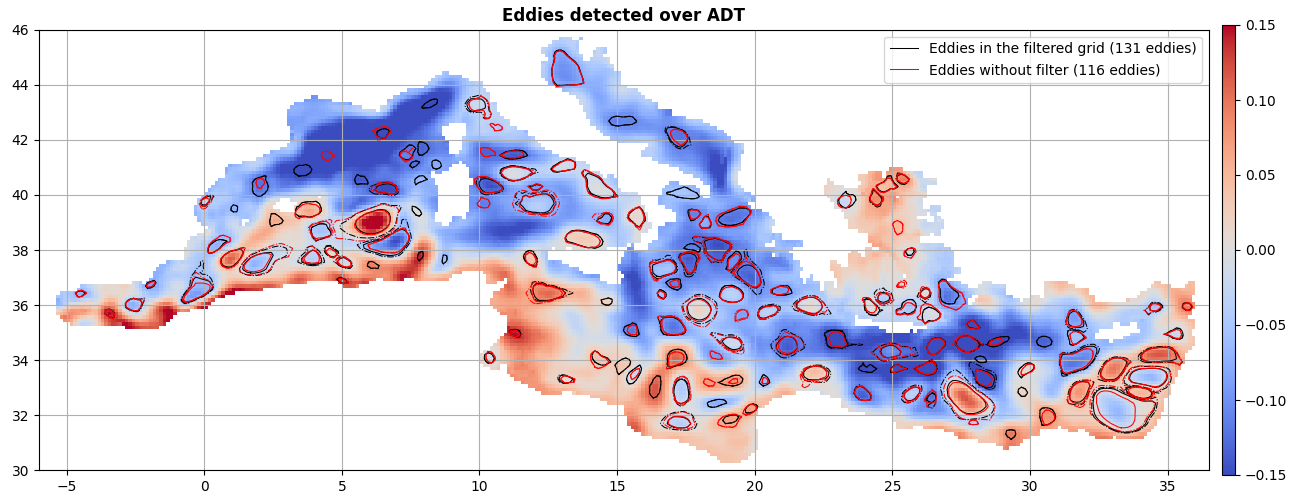
Display the two detections
ax = start_axes("Eddies detected over ADT")
m = g.display(ax, "adt", vmin=-0.15, vmax=0.15)
merge_f.display(
    ax,
    lw=0.75,
    label="Eddies in the filtered grid ({nb_obs} eddies)",
    ref=-10,
    color="k",
)
merge_t.display(
    ax, lw=0.75, label="Eddies without filter ({nb_obs} eddies)", ref=-10, color="r"
)
ax.legend()
update_axes(ax, m)
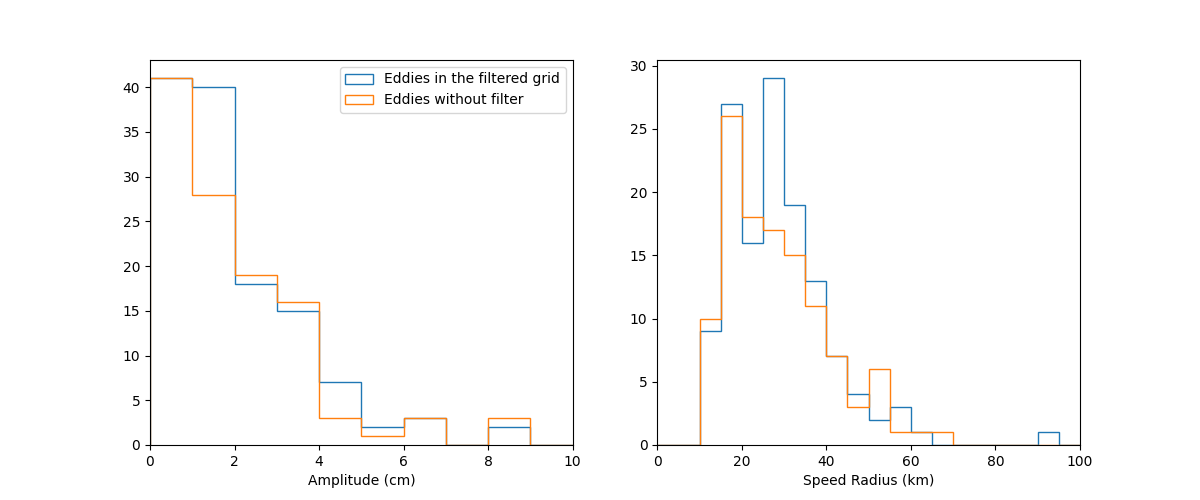
Amplitude and Speed Radius distributions
fig = plt.figure(figsize=(12, 5))
ax_a = fig.add_subplot(121, xlabel="Amplitude (cm)")
ax_r = fig.add_subplot(122, xlabel="Speed Radius (km)")
ax_a.hist(
    merge_f.amplitude * 100,
    bins=arange(0.0005, 100, 1),
    label="Eddies in the filtered grid",
    histtype="step",
)
ax_a.hist(
    merge_t.amplitude * 100,
    bins=arange(0.0005, 100, 1),
    label="Eddies without filter",
    histtype="step",
)
ax_a.set_xlim(0, 10)
ax_r.hist(merge_f.radius_s / 1000.0, bins=arange(0, 300, 5), histtype="step")
ax_r.hist(merge_t.radius_s / 1000.0, bins=arange(0, 300, 5), histtype="step")
ax_r.set_xlim(0, 100)
ax_a.legend()
<matplotlib.legend.Legend object at 0x7f25187bfb20>
Match detection and compare
i_, j_, c = merge_f.match(merge_t, cmin=0.1)
Where are the lonely eddies?
kwargs_f = dict(lw=1.5, label="Lonely eddies in the filtered grid", ref=-10, color="k")
kwargs_t = dict(lw=1.5, label="Lonely eddies without filter", ref=-10, color="r")
ax = start_axes("Eddies with no match, over filtered ADT")
mappable = g.display(ax, "adt_high", vmin=-0.15, vmax=0.15)
merge_f.index(i_, reverse=True).display(ax, **kwargs_f)
merge_t.index(j_, reverse=True).display(ax, **kwargs_t)
ax.legend()
update_axes(ax, mappable)

ax = start_axes("Eddies with no match, over filtered ADT (zoom)")
ax.set_xlim(25, 36), ax.set_ylim(31, 35.25)
mappable = g.display(ax, "adt_high", vmin=-0.15, vmax=0.15)
u, v = g.grid("u").T, g.grid("v").T
ax.quiver(g.x_c, g.y_c, u, v, scale=10, pivot="mid", color="gray")
merge_f.index(i_, reverse=True).display(ax, **kwargs_f)
merge_t.index(j_, reverse=True).display(ax, **kwargs_t)
ax.legend()
update_axes(ax, mappable)
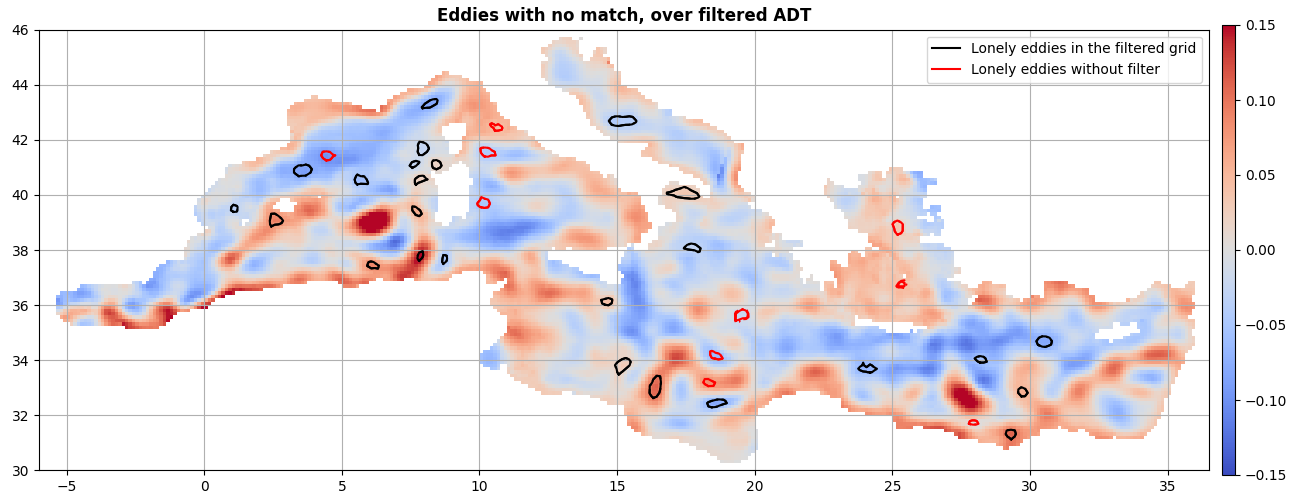
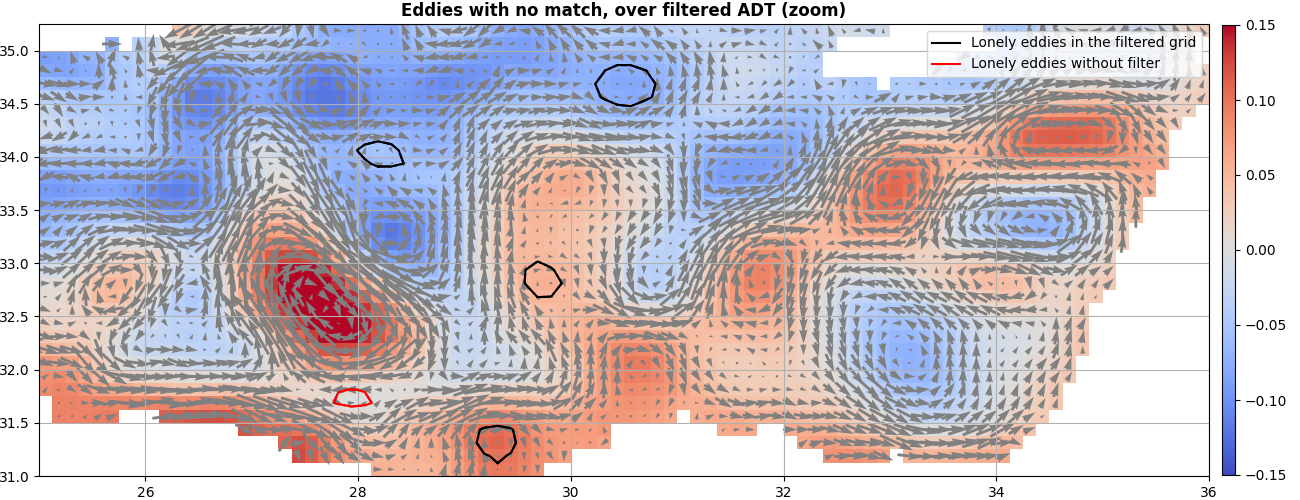
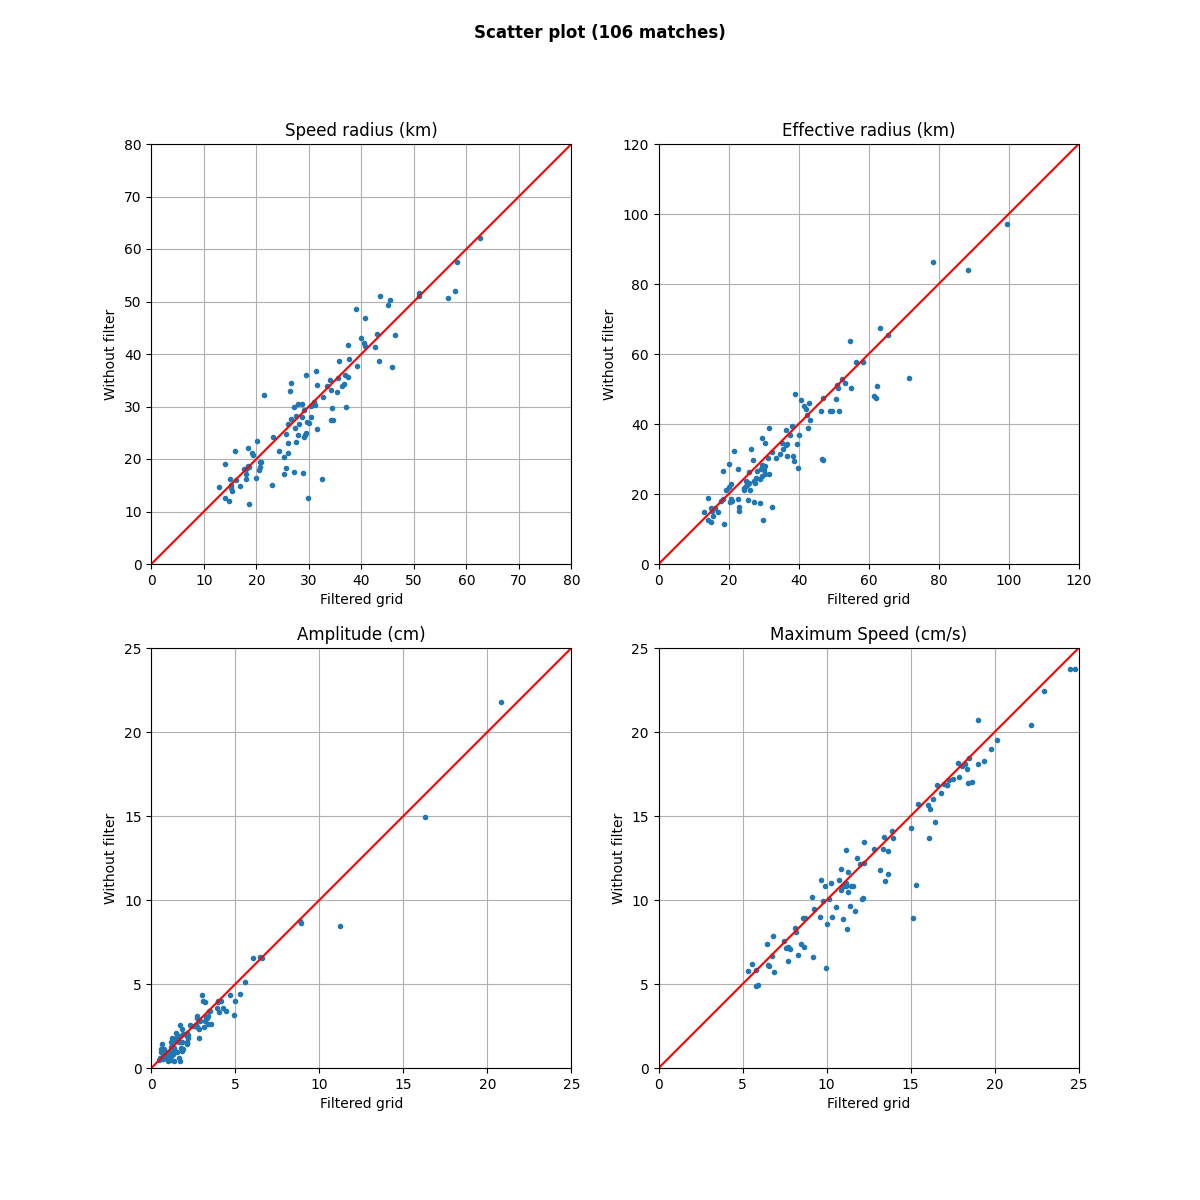
fig = plt.figure(figsize=(12, 12))
fig.suptitle(f"Scatter plot ({i_.shape[0]} matches)", weight="bold")

for i, (label, field, factor, stop) in enumerate(
    (
        ("Speed radius (km)", "radius_s", 0.001, 80),
        ("Effective radius (km)", "radius_e", 0.001, 120),
        ("Amplitude (cm)", "amplitude", 100, 25),
        ("Maximum Speed (cm/s)", "speed_average", 100, 25),
    )
):
    ax = fig.add_subplot(
        2, 2, i + 1, xlabel="Filtered grid", ylabel="Without filter", title=label
    )
    ax.plot(merge_f[field][i_] * factor, merge_t[field][j_] * factor, ".")
    ax.set_aspect("equal"), ax.grid()
    ax.plot((0, 1000), (0, 1000), "r")
    ax.set_xlim(0, stop), ax.set_ylim(0, stop)
Total running time of the script: ( 0 minutes 8.051 seconds)