Note
Go to the end to download the full example code. or to run this example in your browser via Binder
Colocate looper with eddy from altimetry
All loopers data used in this example are a subset from the dataset described in this article [Lumpkin, R. : Global characteristics of coherent vortices from surface drifter trajectories](https://doi.org/10.1002/2015JC011435)
import re

from matplotlib import pyplot as plt
from matplotlib.animation import FuncAnimation
import numpy as np
import py_eddy_tracker_sample

from py_eddy_tracker import data
from py_eddy_tracker.appli.gui import Anim
from py_eddy_tracker.observations.tracking import TrackEddiesObservations
class VideoAnimation(FuncAnimation):
    def _repr_html_(self, *args, **kwargs):
        """To get video in html and have a player"""
        content = self.to_html5_video()
        return re.sub(
            r'width="[0-9]*"\sheight="[0-9]*"', 'width="100%" height="100%"', content
        )

    def save(self, *args, **kwargs):
        if args[0].endswith("gif"):
            # In this case gif is used to create thumbnail which is not used but consume same time than video
            # So we create an empty file, to save time
            with open(args[0], "w") as _:
                pass
            return
        return super().save(*args, **kwargs)


def start_axes(title):
    fig = plt.figure(figsize=(13, 5))
    ax = fig.add_axes([0.03, 0.03, 0.90, 0.94], aspect="equal")
    ax.set_xlim(-6, 36.5), ax.set_ylim(30, 46)
    ax.set_title(title, weight="bold")
    return ax


def update_axes(ax, mappable=None):
    ax.grid()
    if mappable:
        plt.colorbar(mappable, cax=ax.figure.add_axes([0.94, 0.05, 0.01, 0.9]))
Load eddies dataset
cyclonic_eddies = TrackEddiesObservations.load_file(
    py_eddy_tracker_sample.get_demo_path("eddies_med_adt_allsat_dt2018/Cyclonic.zarr")
)
anticyclonic_eddies = TrackEddiesObservations.load_file(
    py_eddy_tracker_sample.get_demo_path(
        "eddies_med_adt_allsat_dt2018/Anticyclonic.zarr"
    )
)
Load loopers dataset
loopers_med = TrackEddiesObservations.load_file(
    data.get_demo_path("loopers_lumpkin_med.nc")
)
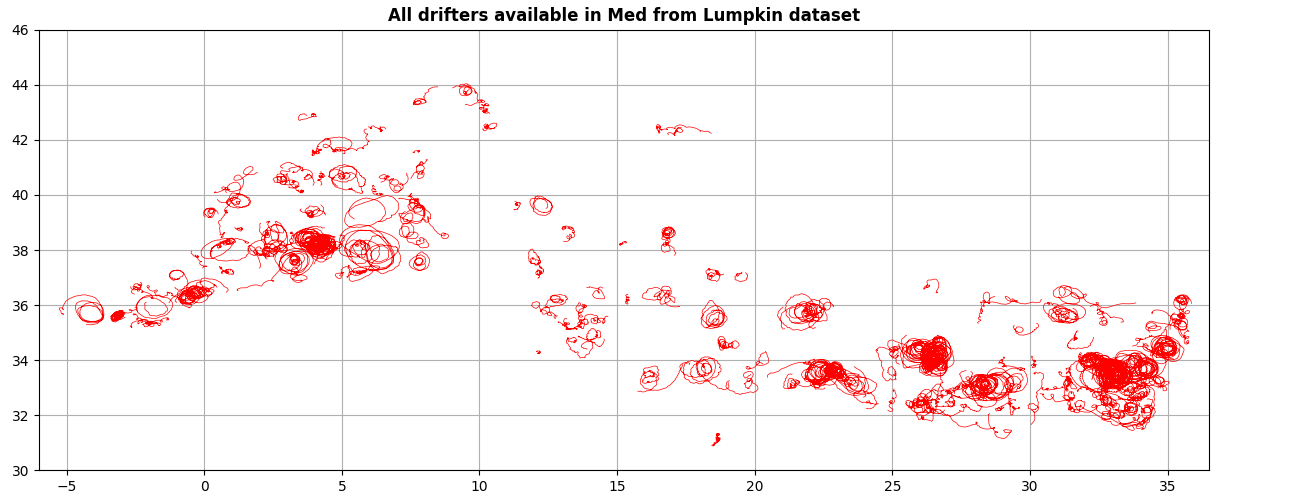
Global view
ax = start_axes("All drifters available in Med from Lumpkin dataset")
loopers_med.plot(ax, lw=0.5, color="r", ref=-10)
update_axes(ax)
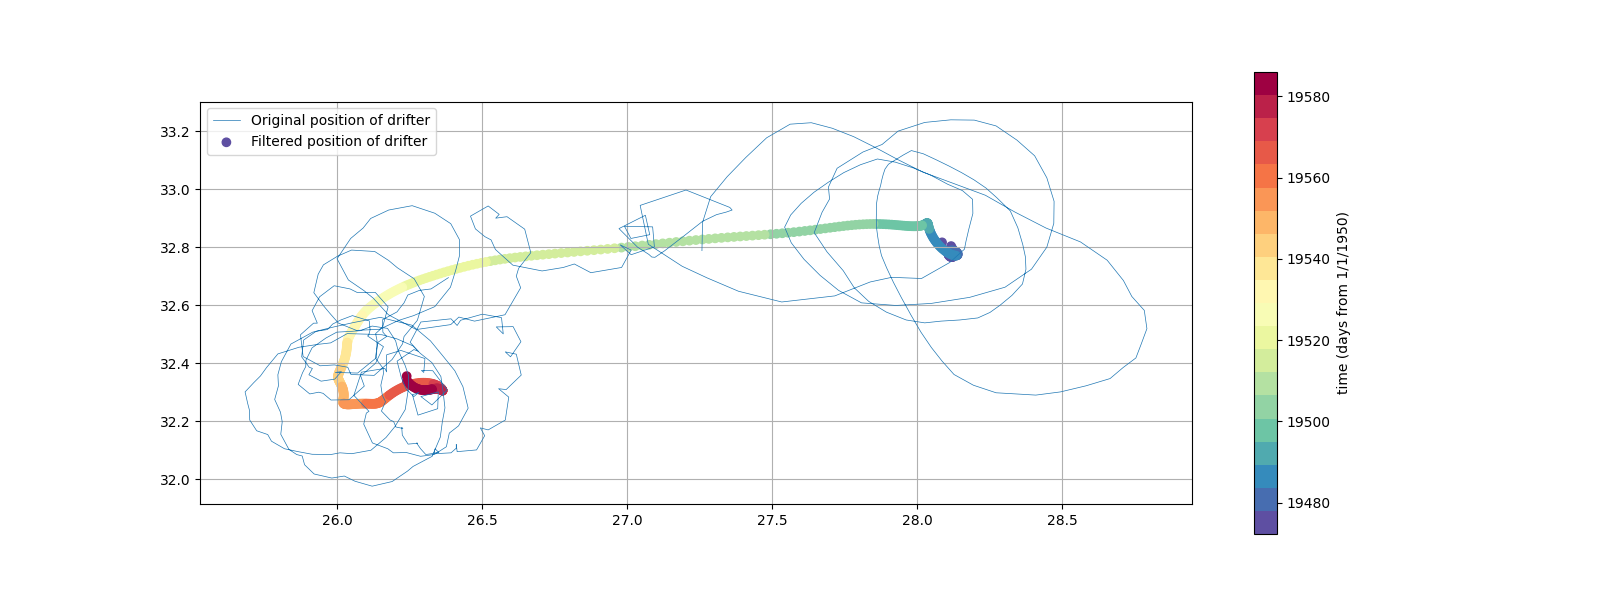
One segment of drifter
Get a drifter segment (the indexes used have no correspondance with the original dataset).
looper = loopers_med.extract_ids((3588,))
fig = plt.figure(figsize=(16, 6))
ax = fig.add_subplot(111, aspect="equal")
looper.plot(ax, lw=0.5, label="Original position of drifter")
looper_filtered = looper.copy()
looper_filtered.position_filter(1, 13)
s = looper_filtered.scatter(
    ax,
    "time",
    cmap=plt.get_cmap("Spectral_r", 20),
    label="Filtered position of drifter",
)
plt.colorbar(s).set_label("time (days from 1/1/1950)")
ax.legend()
ax.grid()
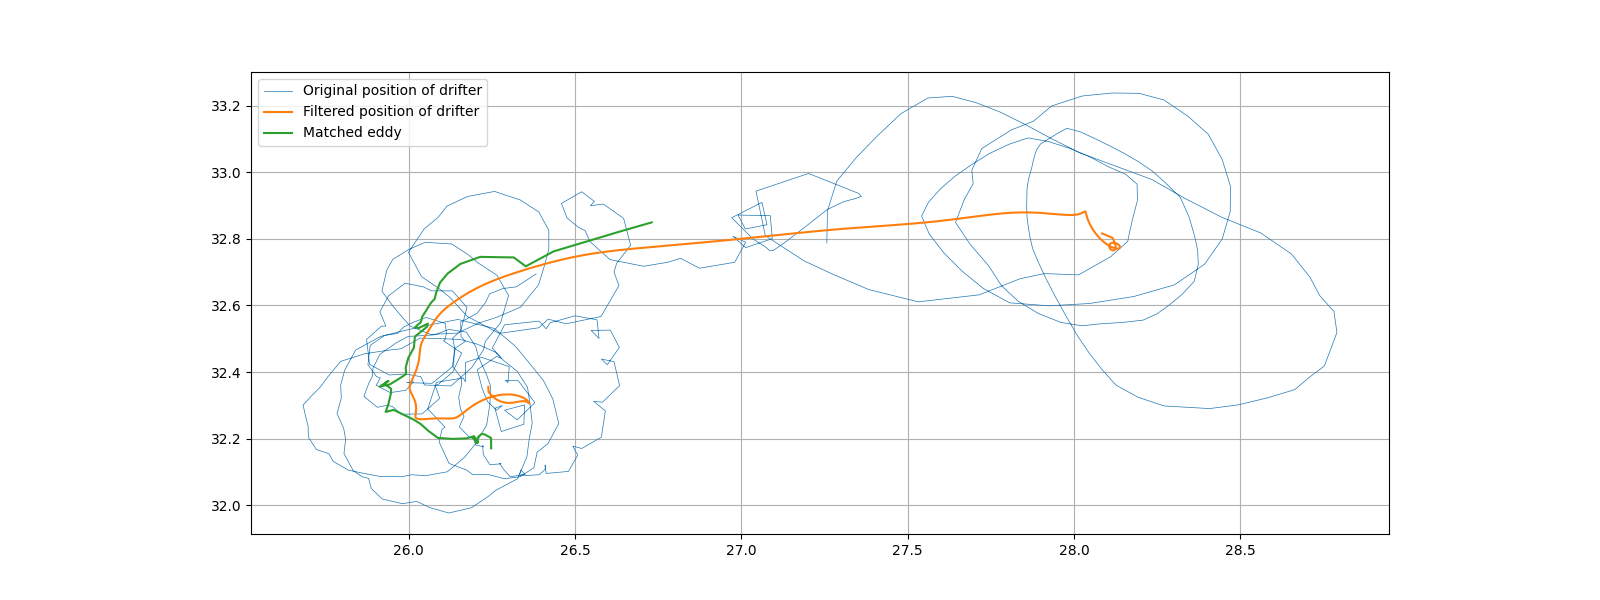
Try to find a detected eddies with adt at same place. We used filtered track to simulate an eddy center
match = looper_filtered.close_tracks(
    anticyclonic_eddies, method="close_center", delta=0.1, nb_obs_min=50
)
fig = plt.figure(figsize=(16, 6))
ax = fig.add_subplot(111, aspect="equal")
looper.plot(ax, lw=0.5, label="Original position of drifter")
looper_filtered.plot(ax, lw=1.5, label="Filtered position of drifter")
match.plot(ax, lw=1.5, label="Matched eddy")
ax.legend()
ax.grid()
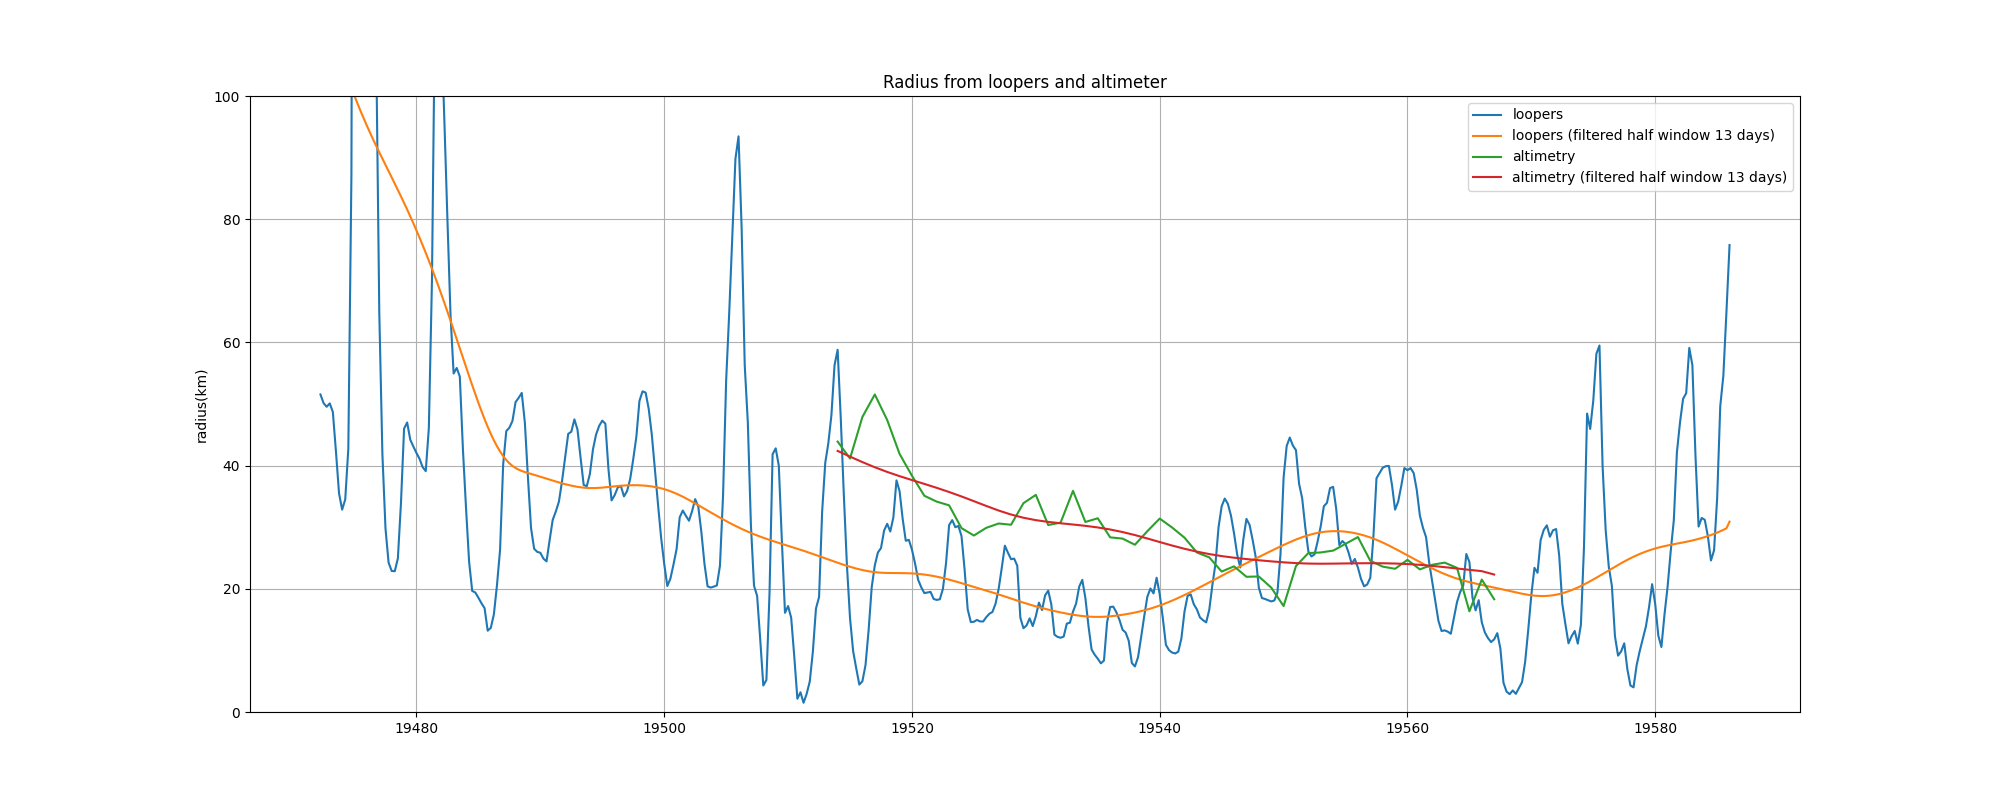
Display radius of this 2 datasets.
fig = plt.figure(figsize=(20, 8))
ax = fig.add_subplot(111)
ax.plot(looper.time, looper.radius_s / 1e3, label="loopers")
looper_radius = looper.copy()
looper_radius.median_filter(1, "time", "radius_s", inplace=True)
looper_radius.loess_filter(13, "time", "radius_s", inplace=True)
ax.plot(
    looper_radius.time,
    looper_radius.radius_s / 1e3,
    label="loopers (filtered half window 13 days)",
)
ax.plot(match.time, match.radius_s / 1e3, label="altimetry")
match_radius = match.copy()
match_radius.median_filter(1, "time", "radius_s", inplace=True)
match_radius.loess_filter(13, "time", "radius_s", inplace=True)
ax.plot(
    match_radius.time,
    match_radius.radius_s / 1e3,
    label="altimetry (filtered half window 13 days)",
)
ax.set_ylabel("radius(km)"), ax.set_ylim(0, 100)
ax.legend()
ax.set_title("Radius from loopers and altimeter")
ax.grid()
Animation of a drifter and its colocated eddy
def update(frame):
    # We display last 5 days of loopers trajectory
    m = (looper.time < frame) * (looper.time > (frame - 5))
    anim.func_animation(frame)
    line.set_data(looper.lon[m], looper.lat[m])


anim = Anim(match, intern=True, figsize=(8, 8), cmap="magma_r", nb_step=10, dpi=75)
# mappable to show drifter in red
line = anim.ax.plot([], [], "r", lw=4, zorder=100)[0]
anim.fig.suptitle("")
_ = VideoAnimation(anim.fig, update, frames=np.arange(*anim.period, 1), interval=125)
Total running time of the script: (0 minutes 6.961 seconds)