Installation
Toolbox gallery:
Grid manipulation
Tracking
Code
All figures in this gallery, used an experimental dataset, compute with this dataset : cmems_product.
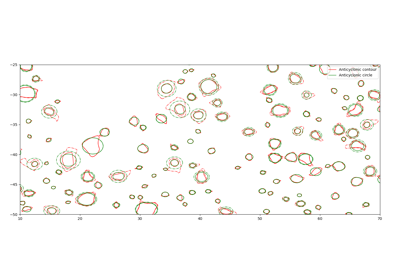
Display contour & circle
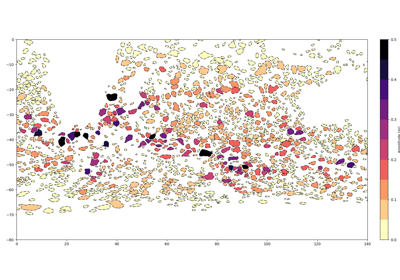
Display identification
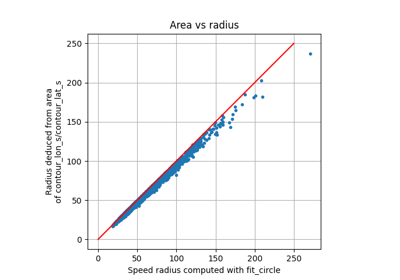
Radius vs area
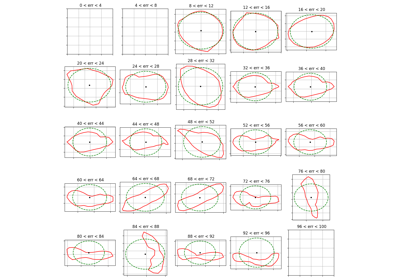
Shape error gallery
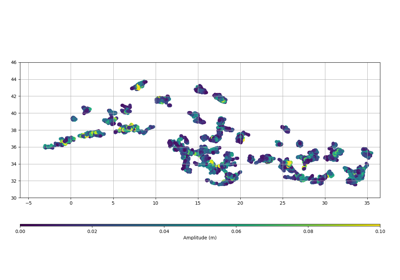
Get mean of grid in each eddies
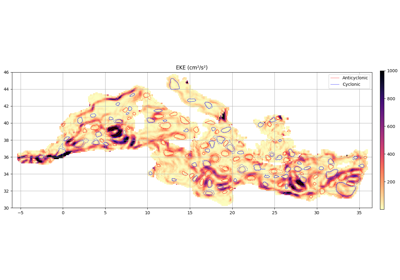
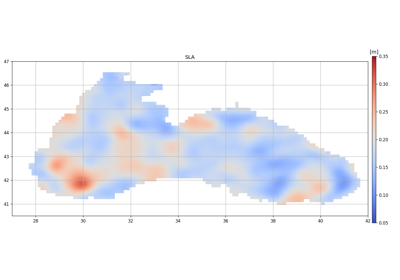
Eddy detection : Med
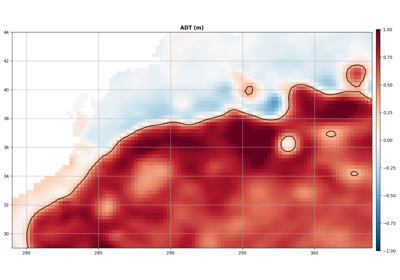
Eddy detection : Gulf stream
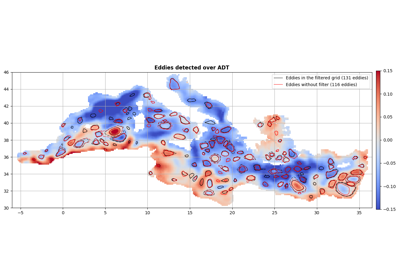
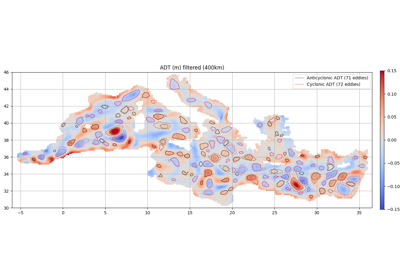
Eddy detection and filter
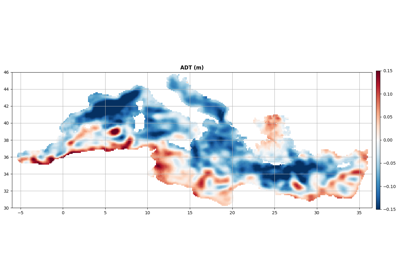
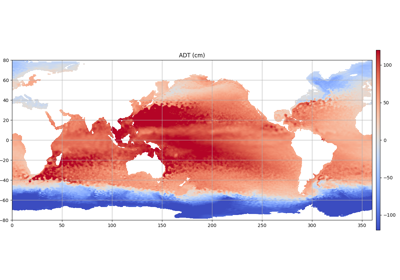
Eddy detection on SLA and ADT
Select pixel in eddies
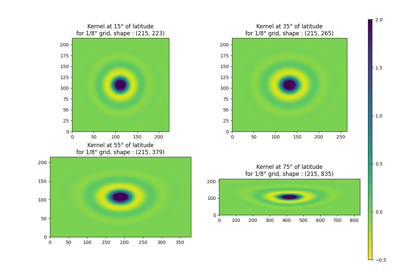
Grid filtering in PET
Get Okubo Weis
Track animation
Display fields
Track animation with standard matplotlib
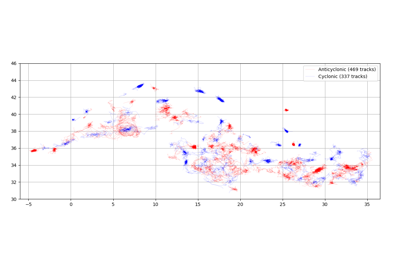
Display Tracks
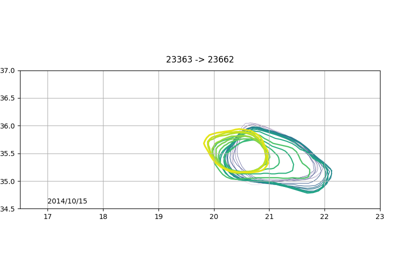
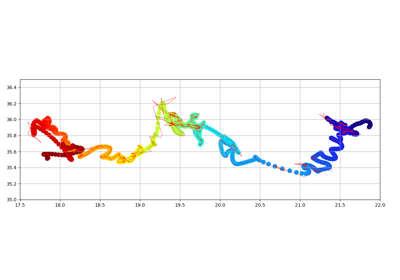
One Track
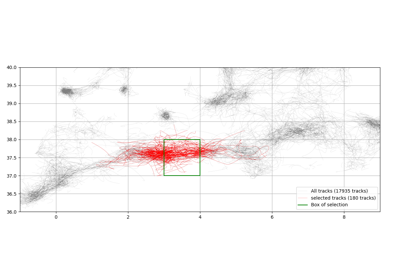
Tracks which go through area
Track in python
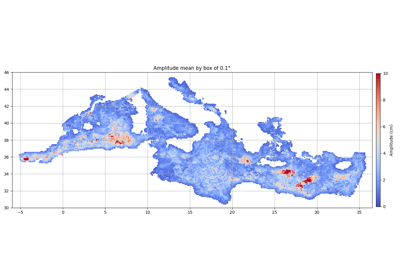
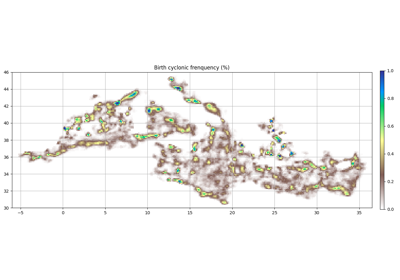
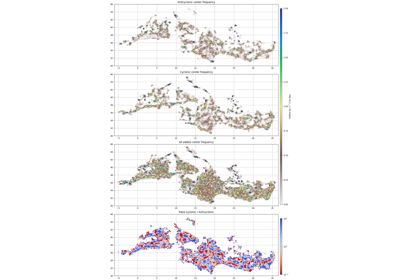
Geographical statistics
Birth and death
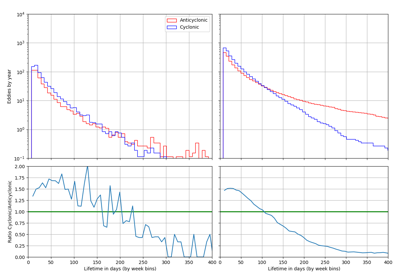
Lifetime Histogram
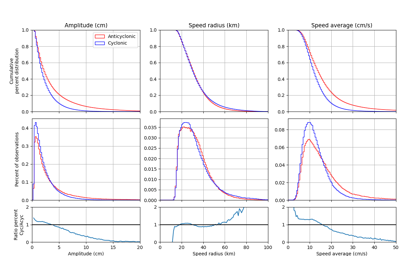
Parameter Histogram
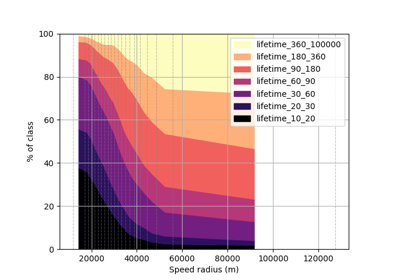
Groups distribution
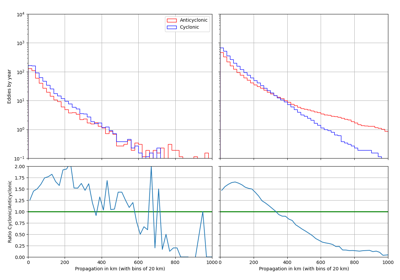
Propagation Histogram
Count pixel used
Count center
Collocating external data
Visvalingam algorithm
Gallery generated by Sphinx-Gallery