Note
Click here to download the full example code or to run this example in your browser via Binder
Geographical statistics
import py_eddy_tracker_sample
from matplotlib import pyplot as plt

from py_eddy_tracker.observations.tracking import TrackEddiesObservations


def start_axes(title):
    fig = plt.figure(figsize=(13.5, 5))
    ax = fig.add_axes([0.03, 0.03, 0.90, 0.94])
    ax.set_xlim(-6, 36.5), ax.set_ylim(30, 46)
    ax.set_aspect("equal")
    ax.set_title(title)
    return ax
Load an experimental med atlas over a period of 26 years (1993-2019), we merge the 2 datasets
a = TrackEddiesObservations.load_file(
    py_eddy_tracker_sample.get_path("eddies_med_adt_allsat_dt2018/Anticyclonic.zarr")
)
c = TrackEddiesObservations.load_file(
    py_eddy_tracker_sample.get_path("eddies_med_adt_allsat_dt2018/Cyclonic.zarr")
)
a = a.merge(c)

step = 0.1
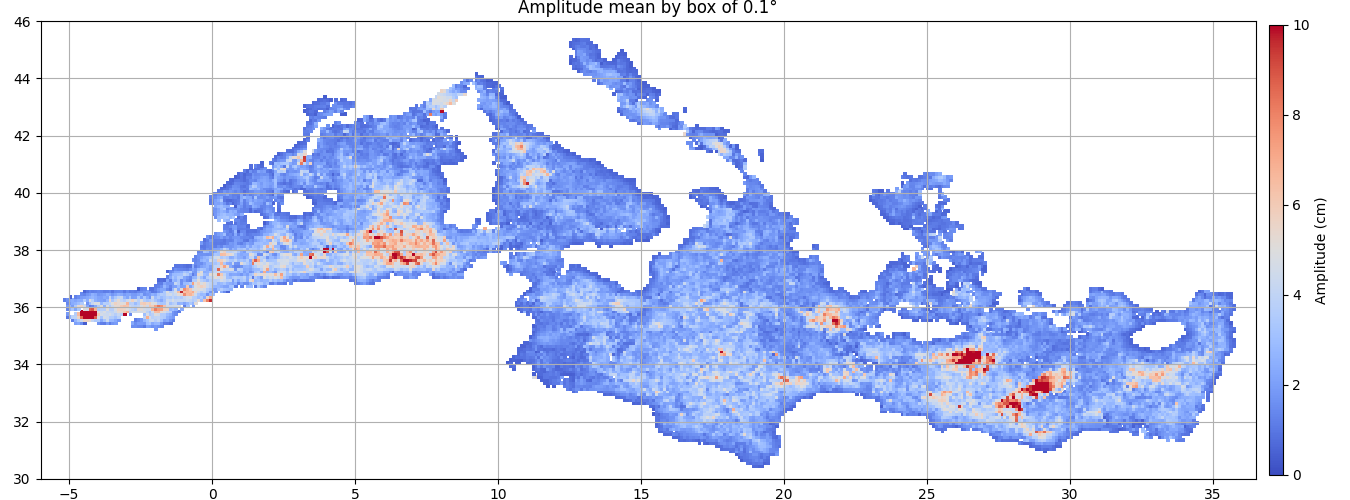
Mean of amplitude in each box
ax = start_axes("Amplitude mean by box of %s°" % step)
g = a.grid_stat(((-7, 37, step), (30, 46, step)), "amplitude")
m = g.display(ax, name="amplitude", vmin=0, vmax=10, factor=100)
ax.grid()
cb = plt.colorbar(m, cax=ax.figure.add_axes([0.94, 0.05, 0.01, 0.9]))
cb.set_label("Amplitude (cm)")
Out:
/home/docs/checkouts/readthedocs.org/user_builds/py-eddy-tracker/envs/v3.3.1/lib/python3.7/site-packages/pyEddyTracker-3.3.1-py3.7.egg/py_eddy_tracker/dataset/grid.py:1893: MatplotlibDeprecationWarning: shading='flat' when X and Y have the same dimensions as C is deprecated since 3.3.  Either specify the corners of the quadrilaterals with X and Y, or pass shading='auto', 'nearest' or 'gouraud', or set rcParams['pcolor.shading'].  This will become an error two minor releases later.
  return ax.pcolormesh(x, self.y_bounds, data.T * factor, **kwargs)
Mean of speed radius in each box
ax = start_axes("Speed radius mean by box of %s°" % step)
g = a.grid_stat(((-7, 37, step), (30, 46, step)), "radius_s")
m = g.display(ax, name="radius_s", vmin=10, vmax=50, factor=0.001)
ax.grid()
cb = plt.colorbar(m, cax=ax.figure.add_axes([0.94, 0.05, 0.01, 0.9]))
cb.set_label("Speed radius (km)")

Out:
/home/docs/checkouts/readthedocs.org/user_builds/py-eddy-tracker/envs/v3.3.1/lib/python3.7/site-packages/pyEddyTracker-3.3.1-py3.7.egg/py_eddy_tracker/dataset/grid.py:1893: MatplotlibDeprecationWarning: shading='flat' when X and Y have the same dimensions as C is deprecated since 3.3.  Either specify the corners of the quadrilaterals with X and Y, or pass shading='auto', 'nearest' or 'gouraud', or set rcParams['pcolor.shading'].  This will become an error two minor releases later.
  return ax.pcolormesh(x, self.y_bounds, data.T * factor, **kwargs)
Percent of virtual on the whole obs in each box
ax = start_axes("Percent of virtual by box of %s°" % step)
g = a.grid_stat(((-7, 37, step), (30, 46, step)), "virtual")
g.vars["virtual"] *= 100
m = g.display(ax, name="virtual", vmin=0, vmax=15)
ax.grid()
cb = plt.colorbar(m, cax=ax.figure.add_axes([0.94, 0.05, 0.01, 0.9]))
cb.set_label("Percent of virtual (%)")

Out:
/home/docs/checkouts/readthedocs.org/user_builds/py-eddy-tracker/envs/v3.3.1/lib/python3.7/site-packages/pyEddyTracker-3.3.1-py3.7.egg/py_eddy_tracker/dataset/grid.py:1893: MatplotlibDeprecationWarning: shading='flat' when X and Y have the same dimensions as C is deprecated since 3.3.  Either specify the corners of the quadrilaterals with X and Y, or pass shading='auto', 'nearest' or 'gouraud', or set rcParams['pcolor.shading'].  This will become an error two minor releases later.
  return ax.pcolormesh(x, self.y_bounds, data.T * factor, **kwargs)
Total running time of the script: ( 0 minutes 4.744 seconds)