Eddy identification
Run the identification process for a single day
Shell/bash command
Bash command will allow to process one grid, it will apply a filter and an identification.
EddyId share/nrt_global_allsat_phy_l4_20190223_20190226.nc 20190223 \
    adt ugos vgos longitude latitude \
    out_directory -v DEBUG
Filter could be modify with options –cut_wavelength and –filter_order. You could also defined height between two isolines with –isoline_step, which could improve speed profile quality and detect accurately tiny eddies. You could also use –fit_errmax to manage acceptable shape of eddies.
An eddy identification will produce two files in the output directory, one for anticyclonic eddies and the other one for cyclonic.
In regional area which are away from the equator, current could be deduce from height, juste write None None inplace of ugos vgos
In case of datacube, you need to specify index for each layer (time, depth, …) wiht –indexs option like:
EddyId share/nrt_global_allsat_phy_l4_20190223_20190226.nc 20190223 \
    adt ugos vgos longitude latitude \
    out_directory -v DEBUG --indexs time=0
Warning
If no index are specified, you will apply identification only on dataset first layer, which could be a problem for datacube. Date set in command is used only for output storage.
Python code
If we want customize eddies identification, python module is here.
Activate verbose
from py_eddy_tracker import start_logger
start_logger().setLevel('DEBUG') # Available options: ERROR, WARNING, INFO, DEBUG
Run identification
from datetime import datetime
h = RegularGridDataset(grid_name, lon_name, lat_name)
h.bessel_high_filter('adt', 500, order=3)
date = datetime(2019, 2, 23)
a, c = h.eddy_identification(
    'adt', 'ugos', 'vgos', # Variables used for identification
    date, # Date of identification
    0.002, # step between two isolines of detection (m)
    pixel_limit=(5, 2000), # Min and max pixel count for valid contour
    shape_error=55, # Error max (%) between ratio of circle fit and contour
    )
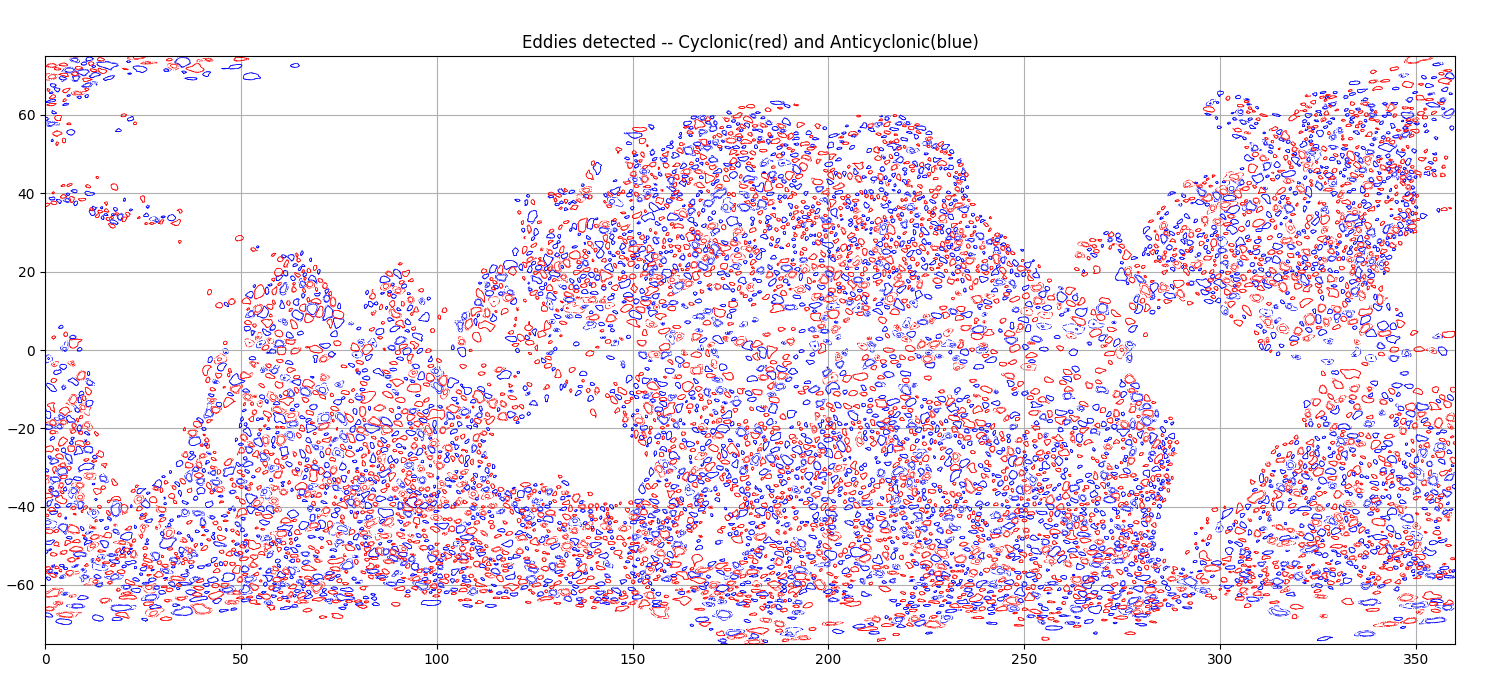
Plot the resulting identification
fig = plt.figure(figsize=(15,7))
ax = fig.add_axes([.03,.03,.94,.94])
ax.set_title('Eddies detected -- Cyclonic(red) and Anticyclonic(blue)')
ax.set_ylim(-75,75)
ax.set_xlim(0,360)
ax.set_aspect('equal')
a.display(ax, color='b', linewidth=.5)
c.display(ax, color='r', linewidth=.5)
ax.grid()
fig.savefig('share/png/eddies.png')
Save identification data
from netCDF import Dataset
with Dataset(date.strftime('share/Anticyclonic_%Y%m%d.nc'), 'w') as h:
    a.to_netcdf(h)
with Dataset(date.strftime('share/Cyclonic_%Y%m%d.nc'), 'w') as h:
    c.to_netcdf(h)