py_eddy_tracker.observations.tracking.TrackEddiesObservations
-
class
py_eddy_tracker.observations.tracking.TrackEddiesObservations(*args, **kwargs)[source]¶ Bases:
py_eddy_tracker.observations.observation.EddiesObservationsClass to practice Tracking on observations
Methods
Add a field of distance (m) between two consecutive observations, 0 for the last observation of each track
add_fieldsAdd a new field.
add_rotation_typealign_onAlign the time indexes of two datasets.
appendMerge.
basic_formula_ellips_major_axisGive major axis in km with a given latitude
bins_stat- param str,array xname
variable to compute stats on
box_displayReturn value evenly spaced with few numbers
build_var_listcircle_contourSet contours as a circles from radius and center data.
Get close trajectories from another atlas.
coherenceCheck coherence between two datasets.
compare_unitsIf obs are not sorted by track, __first_index_of_track will be unusable
containsReturn index of contour which contain (x,y)
copycopy_data_to_zarrCopy with buffer for zarr.
cost_functionReturn the cost function between two obs.
cost_function_common_areaHow does it work on x bound ?
Count by track
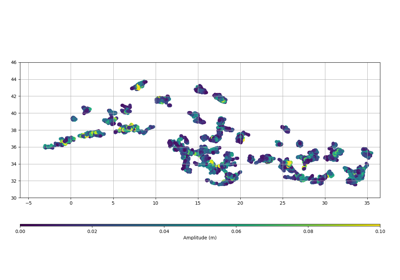
create_variablecreate_variable_zarrdisplayPlot the speed and effective (dashed) contour of the eddies
This function will draw the shape of each trajectory
distanceUse haversine distance for distance matrix between every self and other eddies.
- return
array of distance in m, 0 when next obs if from another track
Select the trajectories longer than nb_min
Get trajectories going in the same direction
extract_with_areaExtract geographically with a bounding box.
Return the observations within trajectories lasting between [b0:b1]
Extract a subset of observations
Extract within a time period
filled- param matplotlib.axes.Axes ax
matplotlib axe used to draw
Filled selected values by interpolation
first_obsGet first obs of each trajectory.
fixed_ellipsoid_maskAssociate the observations to the segments
from_netcdffrom_zarrReturn azimuth for each track.
get_infosgrid_box_statGet percentile of eddies in each bin
grid_countCount the eddies in each bin (use all pixels in each contour)
grid_statReturn the mean of the eddies’ variable in each bin
histBuild histograms.
indexReturn obs from self at the index.
insert_observationsInsert other obs in self at the index.
insideTrue for each point inside the effective contour of an eddy
interninterp_gridInterpolate a grid on a center or contour with mean, min or max method
is_convexGet flag of the eddy’s convexity
iter_onYield observation group for each bin.
Yield track
last_obsGet Last obs of each trajectory.
load_fileLoad the netcdf or the zarr file.
load_from_netcdfLoad data from netcdf.
load_from_zarrLoad data from zarr.
mask_functionmatchReturn index and score computed on the effective contour.
mergeMerge two datasets.
merge_filtersCompute an intersection between all filters after to evaluate each of them
needed_variablenetcdf_create_dimensionsnew_likeForward association of observations to the segments
Normalize all longitude
obs_dimensionparse_varnameThis function will draw path of each trajectory
post_process_linkBackward association of observations to the segments
propagateFilled virtual obs (C).
resetscatterScatter data.
Set global attr
set_global_attr_zarrWill split one group (network) in segments
Get the polygon enclosing each trajectory.
shifted_ellipsoid_degrees_masksolve_conflictsolve_firstsolve_functionsolve_simultaneousWrite something (TODO)
Return each group (network) divided in segments
to_netcdfto_zarrtrackingTrack obs between self and other
write_fileWrite a netcdf or zarr with eddy obs.
zarr_dimensionAttributes
COLORSNB_COLORSReturn age in % for each observation, will be [0:100]
array_variablesdtypeReturn dtype to build numpy array.
Return all the names of the variables.
global_attrReturn lifetime for each observation
nb_daysReturn period days cover by dataset
Will count and send number of track
obsReturn observations.
observationsonly_variablesperiodGive the time coverage
period_raw_datashapesign_legendsign_typetrack_array_variablestrack_extra_variablestracks-
ELEMENTS= ['lon', 'lat', 'radius_s', 'radius_e', 'speed_area', 'effective_area', 'amplitude', 'speed_average', 'time', 'shape_error_e', 'shape_error_s', 'nb_contour_selected', 'num_point_e', 'num_point_s', 'height_max_speed_contour', 'height_external_contour', 'height_inner_contour', 'cost_association']
-
NOGROUP= 0
-
add_distance()[source]¶ Add a field of distance (m) between two consecutive observations, 0 for the last observation of each track
-
property
age¶ Return age in % for each observation, will be [0:100]
-
close_tracks(other, nb_obs_min=10, **kwargs)[source]¶ Get close trajectories from another atlas.
- Parameters
- Returns
return other atlas reduce to common track with self
Warning
It could be a costly operation for huge dataset
-
count_by_track(mask)[source]¶ Count by track
- Parameters
mask (array[bool]) – Mask of boolean count +1 if true
- Returns
Return count by track
- Return type
array
-
display_shape(ax, ref=None, intern=False, **kwargs)[source]¶ This function will draw the shape of each trajectory
- Parameters
ax (matplotlib.axes.Axes) – ax to draw
ref (float,int) – if defined all coordinates will be wrapped with ref like west boundary
intern (bool) – If True use speed contour instead of effective contour
kwargs (dict) – keyword arguments for Axes.plot
- Returns
matplotlib mappable
-
distance_to_next()[source]¶ - Returns
array of distance in m, 0 when next obs if from another track
- Return type
array
-
property
elements¶ Return all the names of the variables.
-
extract_longer_eddies(nb_min, nb_obs, compress_id=True)[source]¶ Select the trajectories longer than nb_min
-
extract_toward_direction(west=True, delta_lon=None)[source]¶ Get trajectories going in the same direction
-
extract_with_length(bounds)[source]¶ Return the observations within trajectories lasting between [b0:b1]
-
extract_with_mask(mask, full_path=False, remove_incomplete=False, compress_id=False, reject_virtual=False)[source]¶ Extract a subset of observations
- Parameters
mask (array(bool)) – mask to select observations
full_path (bool) – extract the full trajectory if only one part is selected
remove_incomplete (bool) – delete trajectory if not fully selected
compress_id (bool) – resample trajectory number to use a smaller range
reject_virtual (bool) – if only virtual are selected, the trajectory is removed
- Returns
same object with the selected observations
- Return type
self.__class__
-
extract_with_period(period, **kwargs)[source]¶ Extract within a time period
- Parameters
period ((int,int)) – two dates to define the period, must be specify from 1/1/1950
kwargs (dict) – look at
extract_with_mask()
- Returns
Return all eddy tracks which are in bounds
- Return type
-
filled_by_interpolation(mask)[source]¶ Filled selected values by interpolation
- Parameters
mask (array(bool)) – True if must be filled by interpolation
-
classmethod
follow_obs(i_next, track_id, used, ids, *args, **kwargs)[source]¶ Associate the observations to the segments
-
get_azimuth(equatorward=False)[source]¶ Return azimuth for each track.
Azimuth is computed with first and last observation
- Parameters
equatorward (bool) – If True, Poleward are positive and equatorward negative
- Return type
array
-
property
index_from_track
-
property
lifetime¶ Return lifetime for each observation
-
property
nb_obs_by_track
-
property
nb_tracks¶ Will count and send number of track
-
static
next_obs(i_current, ids, x, y, time_s, time_e, time_ref, window, **kwargs)[source]¶ Forward association of observations to the segments
-
normalize_longitude()[source]¶ Normalize all longitude
Normalize longitude field and in the same range : - longitude_max - contour_lon_e (how to do if in raw) - contour_lon_s (how to do if in raw)
-
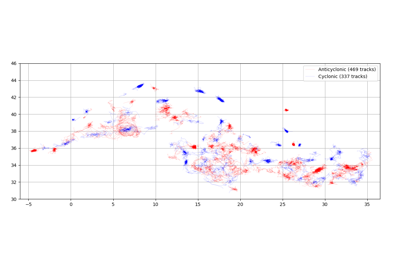
plot(ax, ref=None, **kwargs)[source]¶ This function will draw path of each trajectory
- Parameters
ax (matplotlib.axes.Axes) – ax to draw
ref (float,int) – if defined, all coordinates will be wrapped with ref like west boundary
kwargs (dict) – keyword arguments for Axes.plot
- Returns
matplotlib mappable
-
static
previous_obs(i_current, ids, x, y, time_s, time_e, time_ref, window, **kwargs)[source]¶ Backward association of observations to the segments
-
set_tracks(x, y, ids, window, **kwargs)[source]¶ Will split one group (network) in segments
- Parameters
x (array) – coordinates of group
y (array) – coordinates of group
ids (ndarray) – several fields like time, group, …
windows (int) – number of days where observations could missed