Note
Click here to download the full example code or to run this example in your browser via Binder
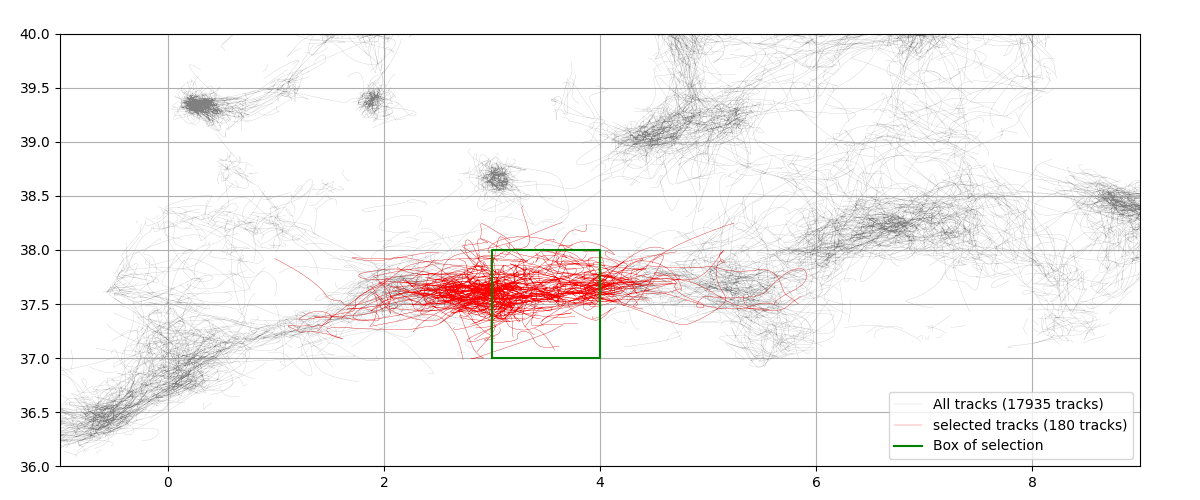
Tracks which go through area
import py_eddy_tracker_sample
from matplotlib import pyplot as plt

from py_eddy_tracker.observations.tracking import TrackEddiesObservations
Load experimental atlas, we filter position to have nice display
c = TrackEddiesObservations.load_file(
    py_eddy_tracker_sample.get_path("eddies_med_adt_allsat_dt2018/Cyclonic.zarr")
)
c.position_filter(median_half_window=1, loess_half_window=5)
We extract eddies in the area set below, but we ask to keep full_path
Plot
fig = plt.figure(figsize=(12, 5))
ax = fig.add_axes((0.05, 0.05, 0.9, 0.9))
ax.set_xlim(-1, 9)
ax.set_ylim(36, 40)
ax.set_aspect("equal")
ax.grid()
c.plot(ax, color="gray", lw=0.1, ref=-10, label="All tracks ({nb_tracks} tracks)")
c_subset.plot(
    ax, color="red", lw=0.2, ref=-10, label="selected tracks ({nb_tracks} tracks)"
)
ax.plot(
    (x0, x0, x1, x1, x0),
    (y0, y1, y1, y0, y0),
    color="green",
    lw=1.5,
    label="Box of selection",
)
ax.legend()
Out:
<matplotlib.legend.Legend object at 0x7f7bc8743390>
Total running time of the script: ( 0 minutes 2.364 seconds)