Note
Click here to download the full example code or to run this example in your browser via Binder
One Track
import py_eddy_tracker_sample
from matplotlib import pyplot as plt

from py_eddy_tracker.observations.tracking import TrackEddiesObservations
Load experimental atlas, and we select one eddy
a = TrackEddiesObservations.load_file(
    py_eddy_tracker_sample.get_path("eddies_med_adt_allsat_dt2018/Anticyclonic.zarr")
)
eddy = a.extract_ids([9672])
eddy_f = a.extract_ids([9672])
eddy_f.position_filter(median_half_window=1, loess_half_window=5)
plot
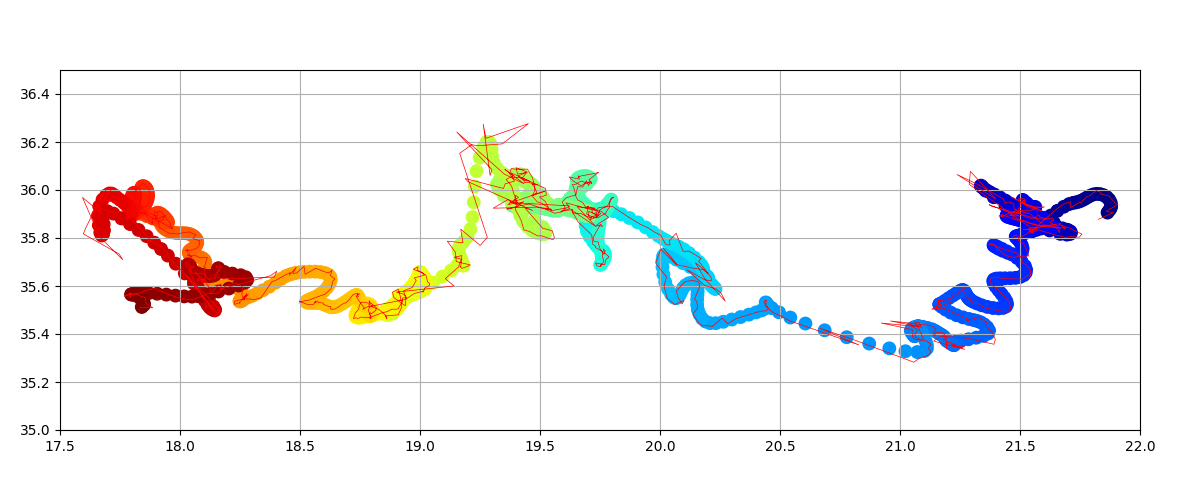
fig = plt.figure(figsize=(12, 5))
ax = fig.add_axes((0.05, 0.05, 0.9, 0.9))
ax.set_xlim(17.5, 22)
ax.set_ylim(35, 36.5)
ax.set_aspect("equal")
ax.grid()
eddy.plot(ax, color="r", lw=0.5)
eddy_f.scatter(ax, "n", cmap="jet", s=80)
Out:
<matplotlib.collections.PathCollection object at 0x7f7bd1ddd550>
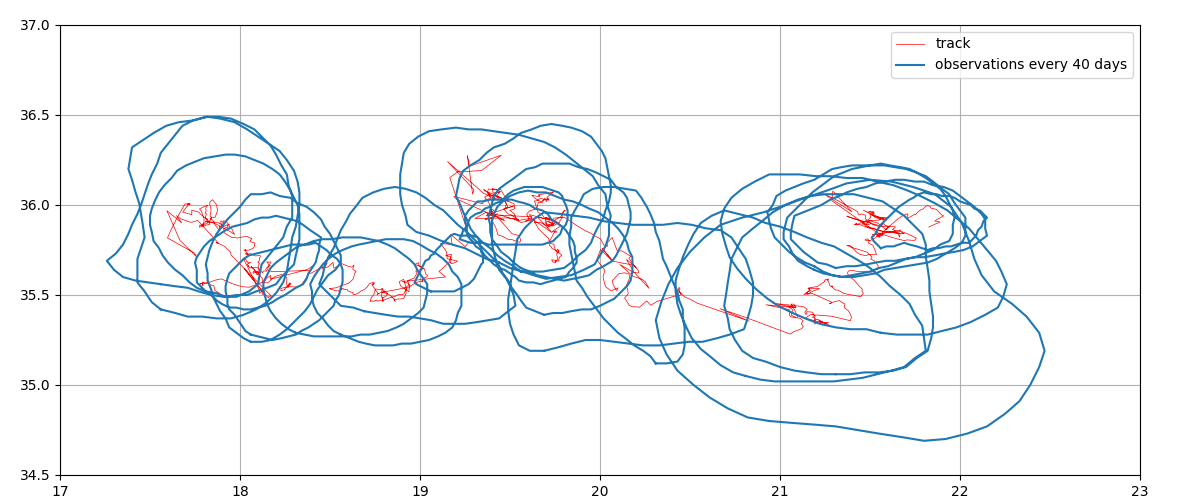
fig = plt.figure(figsize=(12, 5))
ax = fig.add_axes((0.05, 0.05, 0.9, 0.9))
ax.set_xlim(17, 23)
ax.set_ylim(34.5, 37)
ax.set_aspect("equal")
ax.grid()
eddy.plot(ax, color="r", lw=0.5, label="track")
eddy.index(range(0, len(eddy), 40)).display(
    ax, intern_only=True, label="observations every 40 days"
)
ax.legend()
Out:
<matplotlib.legend.Legend object at 0x7f7bc8b909d0>
Total running time of the script: ( 0 minutes 1.191 seconds)