Note
Click here to download the full example code or to run this example in your browser via Binder
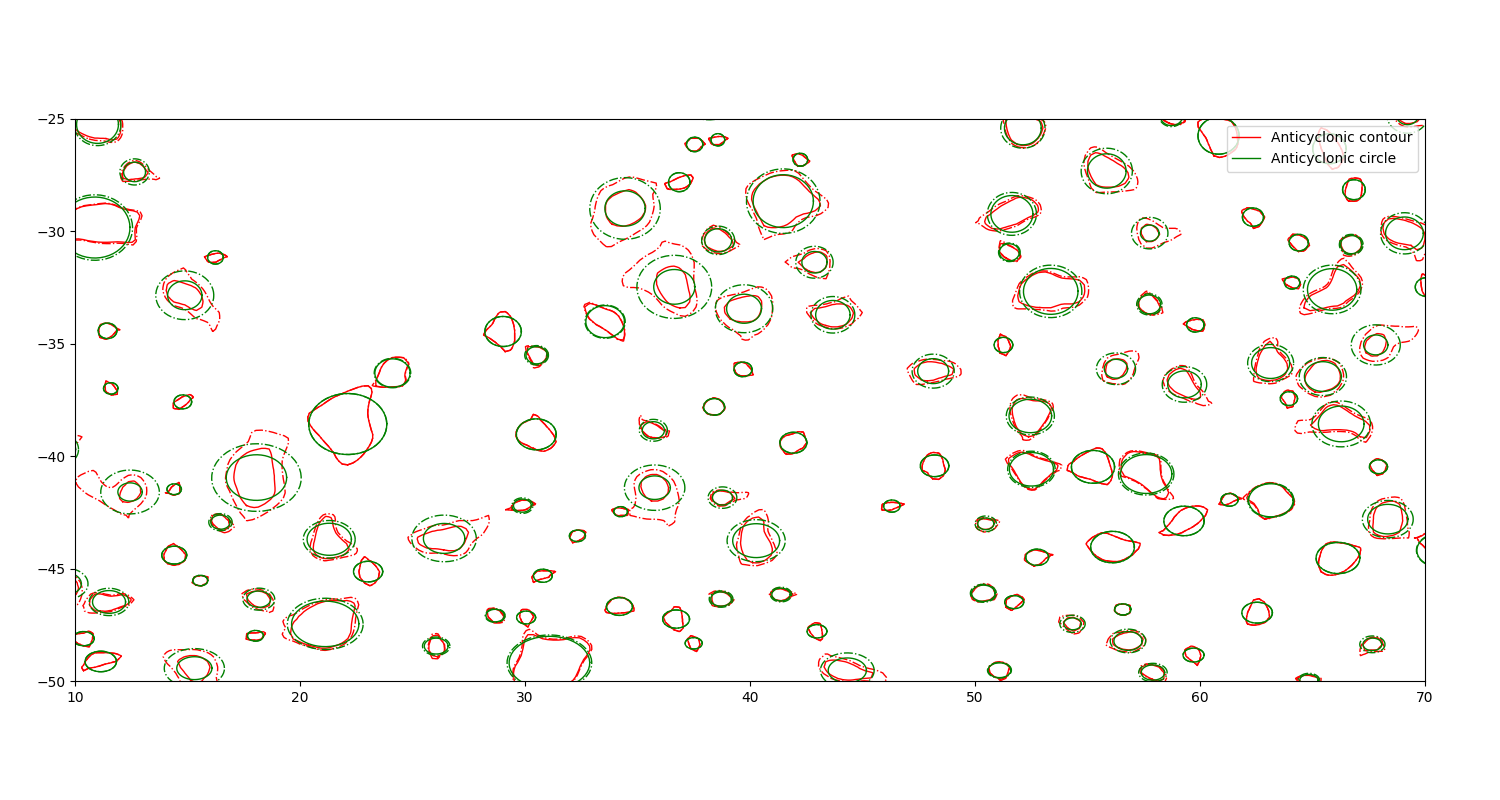
Display contour & circle
from matplotlib import pyplot as plt

from py_eddy_tracker import data
from py_eddy_tracker.observations.observation import EddiesObservations
Load detection files
a = EddiesObservations.load_file(data.get_path("Anticyclonic_20190223.nc"))
Plot the speed and effective (dashed) contours
fig = plt.figure(figsize=(15, 8))
ax = fig.add_axes((0.05, 0.05, 0.9, 0.9))
ax.set_aspect("equal")
ax.set_xlim(10, 70)
ax.set_ylim(-50, -25)
a.display(ax, label="Anticyclonic contour", color="r", lw=1)

# Replace contours by circles using center and radius (effective is dashed)
a.circle_contour()
a.display(ax, label="Anticyclonic circle", color="g", lw=1)
ax.legend(loc="upper right")
Out:
<matplotlib.legend.Legend object at 0x7f7bcb7045d0>
Total running time of the script: ( 0 minutes 1.335 seconds)