Note
Go to the end to download the full example code or to run this example in your browser via Binder
Grid filtering in PET
How filter work in py eddy tracker. This implementation maybe doesn’t respect state art, but …
We code a specific filter in order to filter grid with same wavelength at each pixel.
from matplotlib import pyplot as plt
from numpy import arange

from py_eddy_tracker import data
from py_eddy_tracker.dataset.grid import RegularGridDataset


def start_axes(title):
    fig = plt.figure(figsize=(13, 5))
    ax = fig.add_axes([0.03, 0.03, 0.90, 0.94])
    ax.set_xlim(-6, 36.5), ax.set_ylim(30, 46)
    ax.set_aspect("equal")
    ax.set_title(title)
    return ax


def update_axes(ax, mappable=None):
    ax.grid()
    if mappable:
        plt.colorbar(mappable, cax=ax.figure.add_axes([0.95, 0.05, 0.01, 0.9]))
All information will be for regular grid
g = RegularGridDataset(
    data.get_demo_path("dt_med_allsat_phy_l4_20160515_20190101.nc"),
    "longitude",
    "latitude",
)
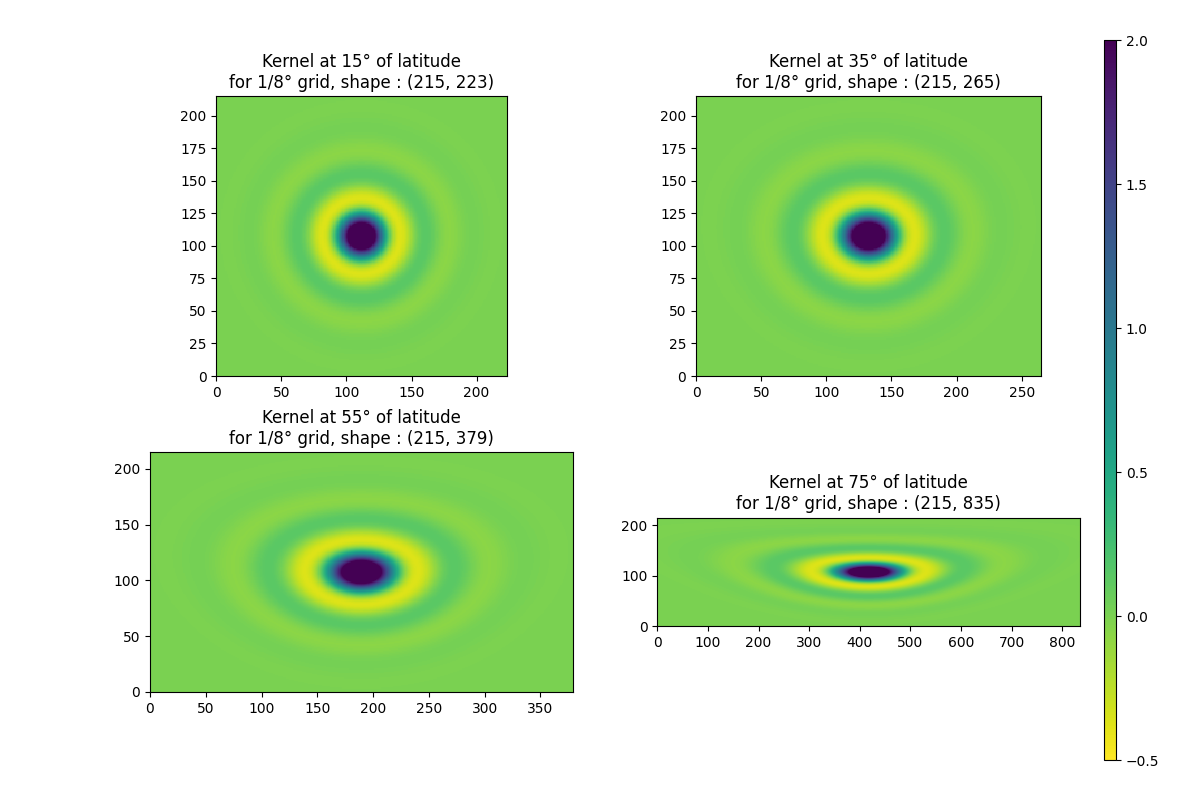
Kernel
Shape of kernel will increase in x, when latitude increase
fig = plt.figure(figsize=(12, 8))
for i, latitude in enumerate((15, 35, 55, 75)):
    k = g.kernel_bessel(latitude, 500, order=3).T
    ax0 = fig.add_subplot(
        2,
        2,
        i + 1,
        title=f"Kernel at {latitude}° of latitude\nfor 1/8° grid, shape : {k.shape}",
        aspect="equal",
    )
    m = ax0.pcolormesh(k, vmin=-0.5, vmax=2, cmap="viridis_r")
plt.colorbar(m, cax=fig.add_axes((0.92, 0.05, 0.01, 0.9)))
<matplotlib.colorbar.Colorbar object at 0x7f251952d120>
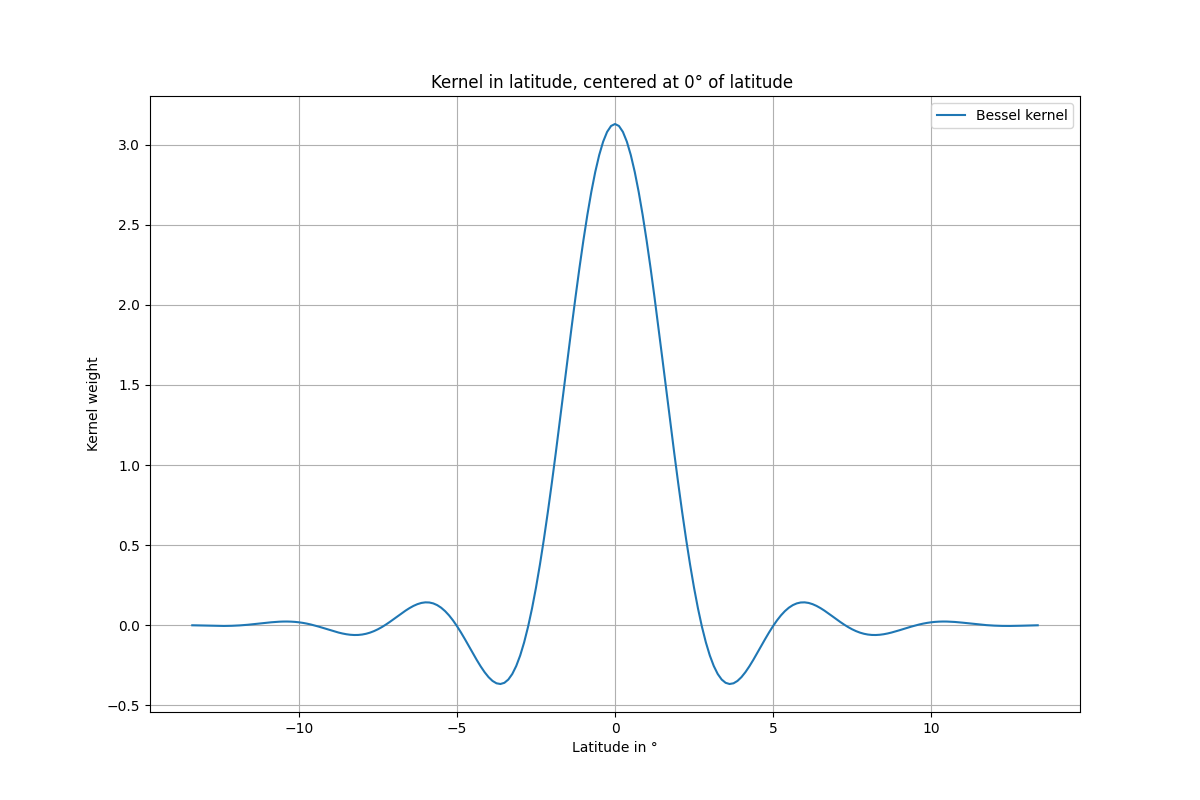
Kernel along latitude
fig = plt.figure(figsize=(12, 8))
ax = fig.add_subplot(
    111,
    ylabel="Kernel weight",
    xlabel="Latitude in °",
    title="Kernel in latitude, centered at 0° of latitude ",
)
k = g.kernel_bessel(0, 500, order=3)
k_lat = k[k.shape[0] // 2 + 1]
nb = k_lat.shape[0] // 2
ax.plot(
    arange(-nb * g.xstep, (nb + 0.5) * g.xstep, g.xstep), k_lat, label="Bessel kernel"
)

ax.legend()
ax.grid()
Kernel applying
Original grid
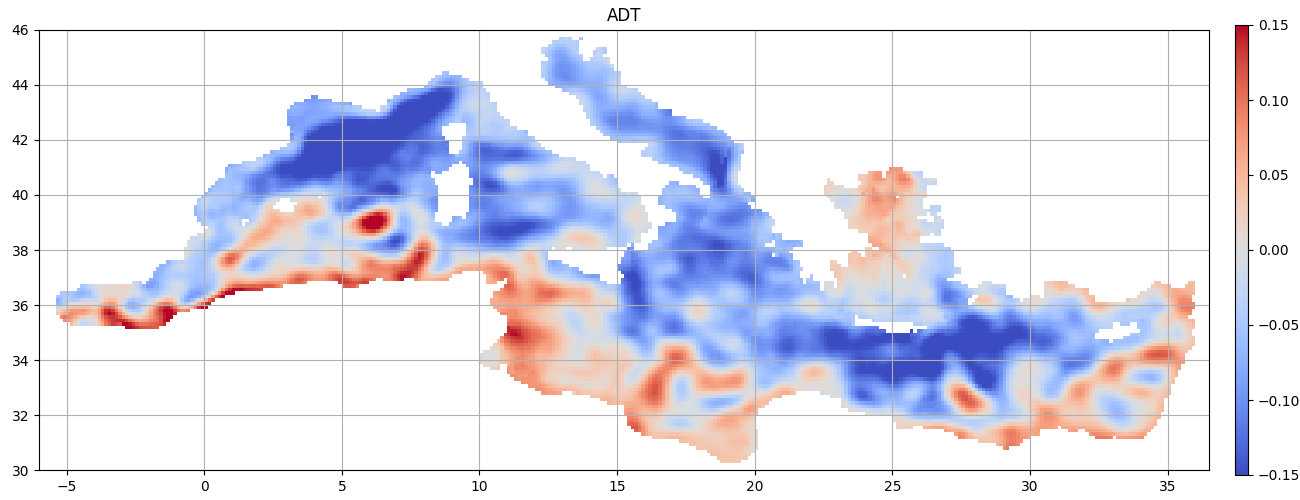
We will select wavelength of 300 km
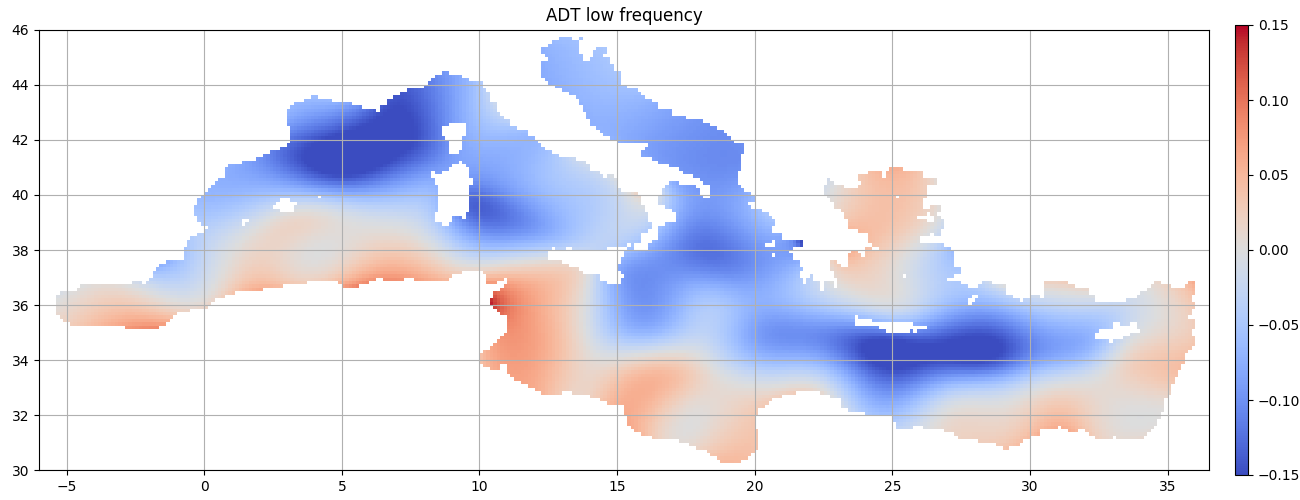
Low frequency
High frequency
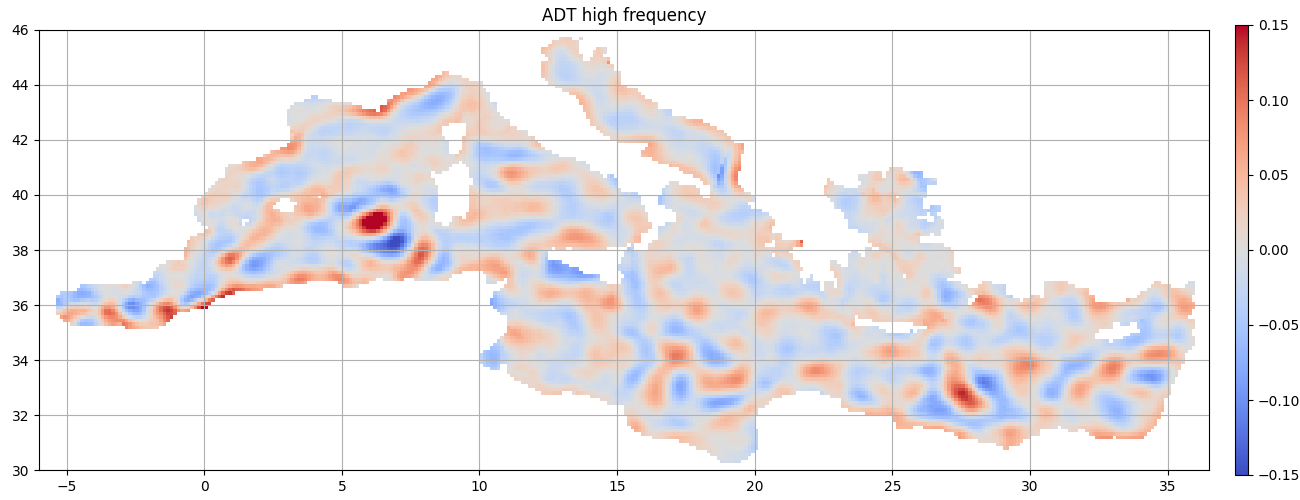
Clues
wavelength : 80km
g.copy("adt", "adt_high_bessel")
g.bessel_high_filter("adt_high_bessel", 80, order=3)
g.copy("adt", "adt_low_bessel")
g.bessel_low_filter("adt_low_bessel", 80, order=3)

area = dict(llcrnrlon=11.75, urcrnrlon=21, llcrnrlat=33, urcrnrlat=36.75)
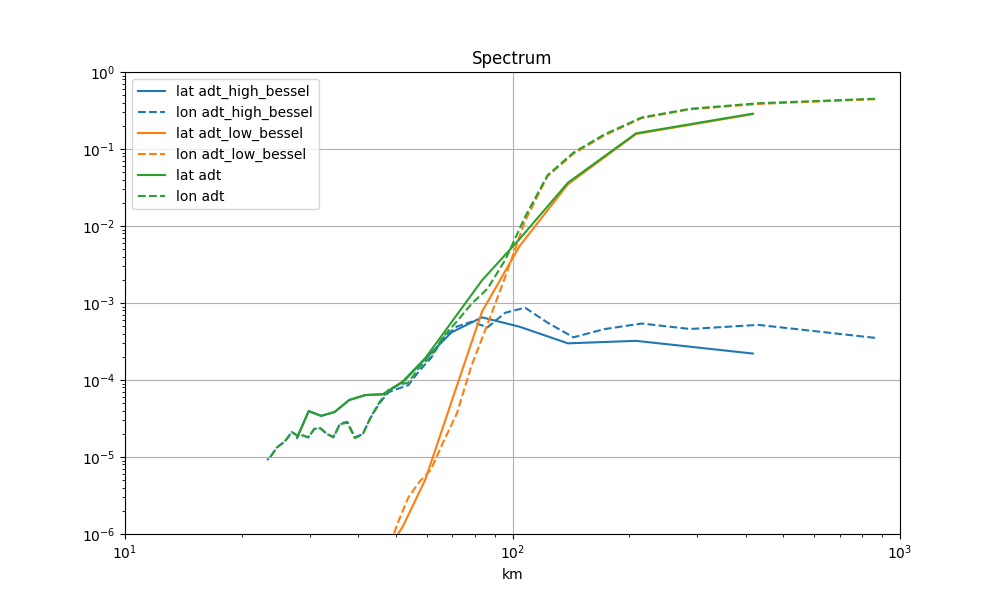
Spectrum
fig = plt.figure(figsize=(10, 6))
ax = fig.add_subplot(111)
ax.set_title("Spectrum")
ax.set_xlabel("km")

for label in ("adt_high_bessel", "adt_low_bessel", "adt"):
    lon_spec, lat_spec = g.spectrum_lonlat(label, area=area)
    mappable = ax.loglog(*lat_spec, label=f"lat {label}")[0]
    ax.loglog(
        *lon_spec, label=f"lon {label}", color=mappable.get_color(), linestyle="--"
    )

ax.set_xlim(10, 1000)
ax.set_ylim(1e-6, 1)
ax.set_xscale("log")
ax.legend()
ax.grid()
/home/docs/checkouts/readthedocs.org/user_builds/py-eddy-tracker/conda/latest/lib/python3.10/site-packages/scipy-1.10.1-py3.10-linux-x86_64.egg/scipy/signal/_spectral_py.py:2014: UserWarning: nperseg = 256 is greater than input length  = 30, using nperseg = 30
  warnings.warn('nperseg = {0:d} is greater than input length '
/home/docs/checkouts/readthedocs.org/user_builds/py-eddy-tracker/conda/latest/lib/python3.10/site-packages/scipy-1.10.1-py3.10-linux-x86_64.egg/scipy/signal/_spectral_py.py:2014: UserWarning: nperseg = 256 is greater than input length  = 74, using nperseg = 74
  warnings.warn('nperseg = {0:d} is greater than input length '
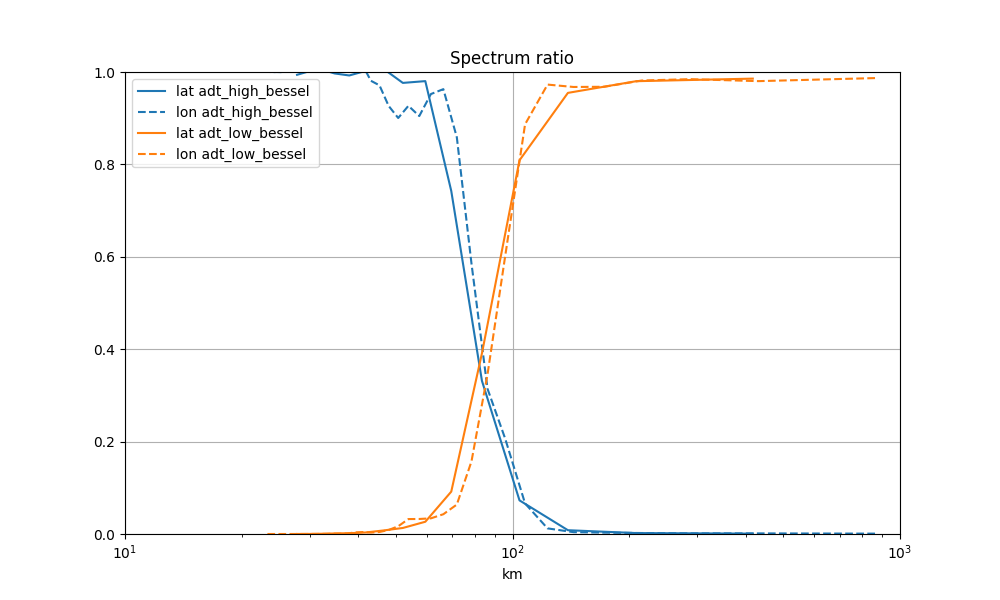
Spectrum ratio
fig = plt.figure(figsize=(10, 6))
ax = fig.add_subplot(111)
ax.set_title("Spectrum ratio")
ax.set_xlabel("km")

for label in ("adt_high_bessel", "adt_low_bessel"):
    lon_spec, lat_spec = g.spectrum_lonlat(label, area=area, ref=g, ref_grid_name="adt")
    mappable = ax.plot(*lat_spec, label=f"lat {label}")[0]
    ax.plot(*lon_spec, label=f"lon {label}", color=mappable.get_color(), linestyle="--")

ax.set_xlim(10, 1000)
ax.set_ylim(0, 1)
ax.set_xscale("log")
ax.legend()
ax.grid()
Old filter
To do …
Total running time of the script: ( 0 minutes 6.204 seconds)