Note
Click here to download the full example code or to run this example in your browser via Binder
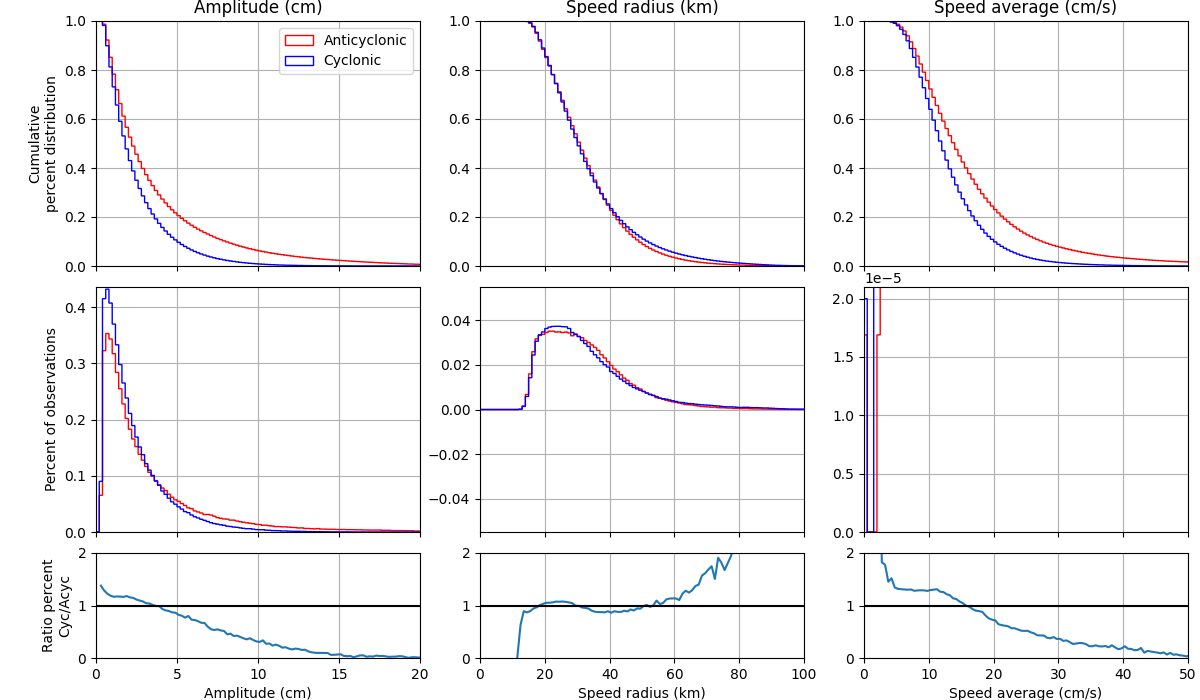
Parameter Histogram
from matplotlib import pyplot as plt
from numpy import arange
import py_eddy_tracker_sample

from py_eddy_tracker.observations.tracking import TrackEddiesObservations
Load an experimental med atlas over a period of 26 years (1993-2019)
a = TrackEddiesObservations.load_file(
    py_eddy_tracker_sample.get_demo_path(
        "eddies_med_adt_allsat_dt2018/Anticyclonic.zarr"
    )
)
c = TrackEddiesObservations.load_file(
    py_eddy_tracker_sample.get_demo_path("eddies_med_adt_allsat_dt2018/Cyclonic.zarr")
)
kwargs_a = dict(label="Anticyclonic", color="r", histtype="step", density=True)
kwargs_c = dict(label="Cyclonic", color="b", histtype="step", density=True)
Plot
fig = plt.figure(figsize=(12, 7))

for x0, name, title, xmax, factor, bins in zip(
    (0.4, 0.72, 0.08),
    ("speed_radius", "speed_average", "amplitude"),
    ("Speed radius (km)", "Speed average (cm/s)", "Amplitude (cm)"),
    (100, 50, 20),
    (0.001, 100, 100),
    (arange(0, 2000, 1), arange(0, 1000, 0.5), arange(0.0005, 1000, 0.2)),
):
    ax_hist = fig.add_axes((x0, 0.24, 0.27, 0.35))
    nb_a, _, _ = ax_hist.hist(a[name] * factor, bins=bins, **kwargs_a)
    nb_c, _, _ = ax_hist.hist(c[name] * factor, bins=bins, **kwargs_c)
    ax_hist.set_xticklabels([])
    ax_hist.set_xlim(0, xmax)
    ax_hist.grid()

    ax_cum = fig.add_axes((x0, 0.62, 0.27, 0.35))
    ax_cum.hist(a[name] * factor, bins=bins, cumulative=-1, **kwargs_a)
    ax_cum.hist(c[name] * factor, bins=bins, cumulative=-1, **kwargs_c)
    ax_cum.set_xticklabels([])
    ax_cum.set_title(title)
    ax_cum.set_xlim(0, xmax)
    ax_cum.set_ylim(0, 1)
    ax_cum.grid()

    ax_ratio = fig.add_axes((x0, 0.06, 0.27, 0.15))
    ax_ratio.set_xlim(0, xmax)
    ax_ratio.set_ylim(0, 2)
    ax_ratio.plot((bins[1:] + bins[:-1]) / 2, nb_c / nb_a)
    ax_ratio.axhline(1, color="k")
    ax_ratio.grid()
    ax_ratio.set_xlabel(title)

ax_cum.set_ylabel("Cumulative\npercent distribution")
ax_hist.set_ylabel("Percent of observations")
ax_ratio.set_ylabel("Ratio percent\nCyc/Acyc")
ax_cum.legend()
/home/docs/checkouts/readthedocs.org/user_builds/py-eddy-tracker/checkouts/stable/examples/10_tracking_diagnostics/pet_histo.py:56: RuntimeWarning: divide by zero encountered in true_divide
  ax_ratio.plot((bins[1:] + bins[:-1]) / 2, nb_c / nb_a)
/home/docs/checkouts/readthedocs.org/user_builds/py-eddy-tracker/checkouts/stable/examples/10_tracking_diagnostics/pet_histo.py:56: RuntimeWarning: invalid value encountered in true_divide
  ax_ratio.plot((bins[1:] + bins[:-1]) / 2, nb_c / nb_a)

<matplotlib.legend.Legend object at 0x7f6c21218c40>
Total running time of the script: ( 0 minutes 3.231 seconds)