Note
Go to the end to download the full example code. or to run this example in your browser via Binder
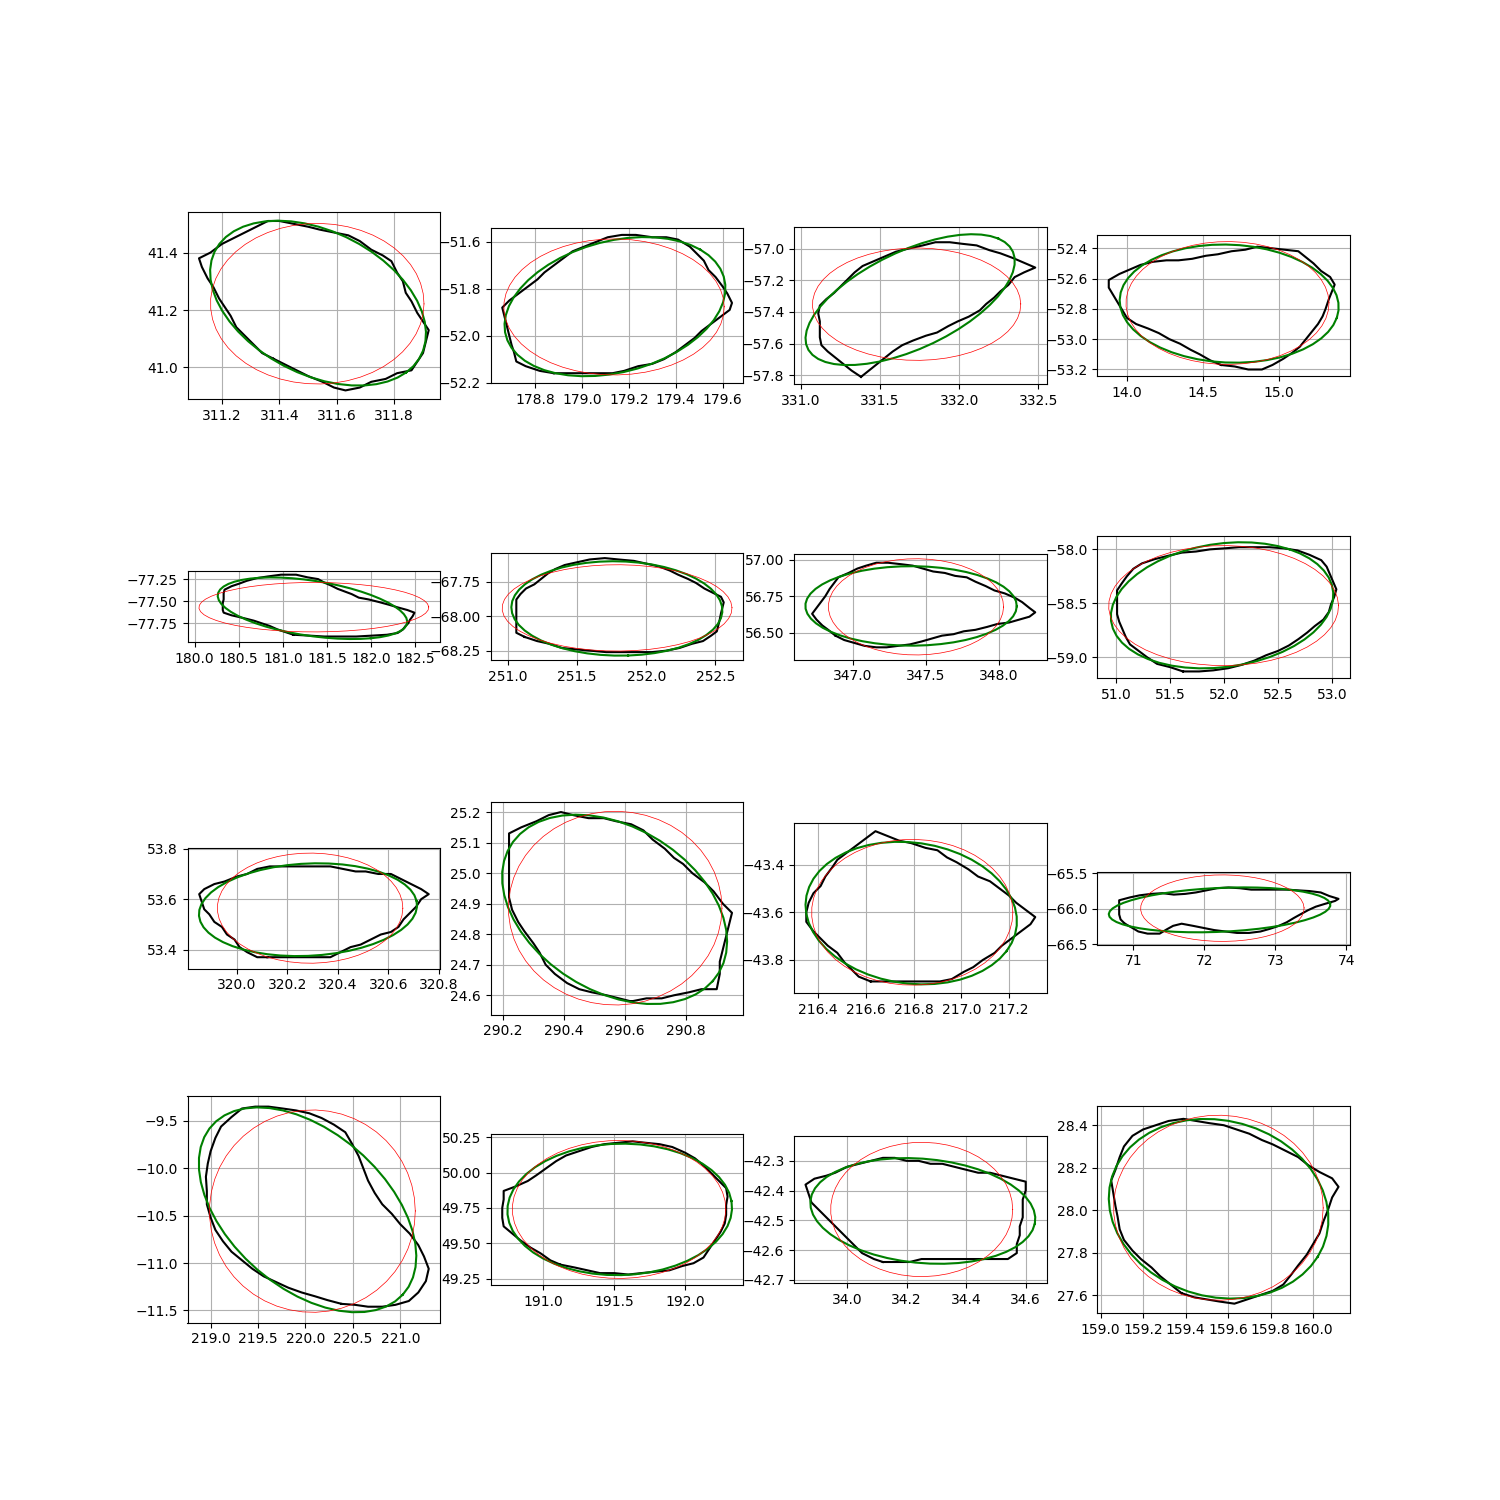
Contour fit
- Two type of fit :
Ellipse
Circle
In the two case we use a least square algorithm
from matplotlib import pyplot as plt
from numpy import cos, linspace, radians, sin

from py_eddy_tracker import data
from py_eddy_tracker.generic import coordinates_to_local, local_to_coordinates
from py_eddy_tracker.observations.observation import EddiesObservations
from py_eddy_tracker.poly import fit_circle_, fit_ellipse
Load example identification file
a = EddiesObservations.load_file(data.get_demo_path("Anticyclonic_20190223.nc"))
Function to draw circle or ellipse from parameter
def build_circle(x0, y0, r):
    angle = radians(linspace(0, 360, 50))
    x_norm, y_norm = cos(angle), sin(angle)
    return local_to_coordinates(x_norm * r, y_norm * r, x0, y0)


def build_ellipse(x0, y0, a, b, theta):
    angle = radians(linspace(0, 360, 50))
    x = a * cos(theta) * cos(angle) - b * sin(theta) * sin(angle)
    y = a * sin(theta) * cos(angle) + b * cos(theta) * sin(angle)
    return local_to_coordinates(x, y, x0, y0)
Plot fitted circle or ellipse on stored contour
xs, ys = a.contour_lon_s, a.contour_lat_s

fig = plt.figure(figsize=(15, 15))

j = 1
for i in range(0, 800, 30):
    x, y = xs[i], ys[i]
    x0_, y0_ = x.mean(), y.mean()
    x_, y_ = coordinates_to_local(x, y, x0_, y0_)
    ax = fig.add_subplot(4, 4, j)
    ax.grid(), ax.set_aspect("equal")
    ax.plot(x, y, label="store", color="black")
    x0, y0, a, b, theta = fit_ellipse(x_, y_)
    x0, y0 = local_to_coordinates(x0, y0, x0_, y0_)
    ax.plot(*build_ellipse(x0, y0, a, b, theta), label="ellipse", color="green")
    x0, y0, radius, shape_error = fit_circle_(x_, y_)
    x0, y0 = local_to_coordinates(x0, y0, x0_, y0_)
    ax.plot(*build_circle(x0, y0, radius), label="circle", color="red", lw=0.5)
    if j == 16:
        break
    j += 1
Total running time of the script: (0 minutes 4.170 seconds)