py_eddy_tracker.poly.fit_circle_
- py_eddy_tracker.poly.fit_circle_(x, y)[source]
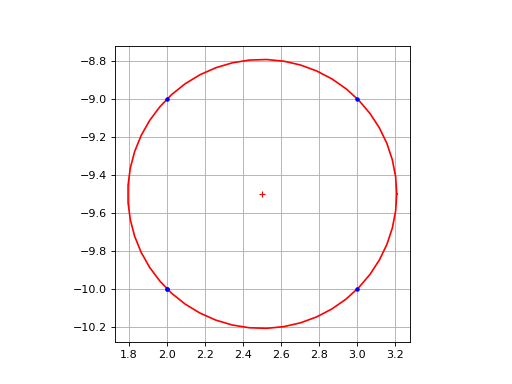
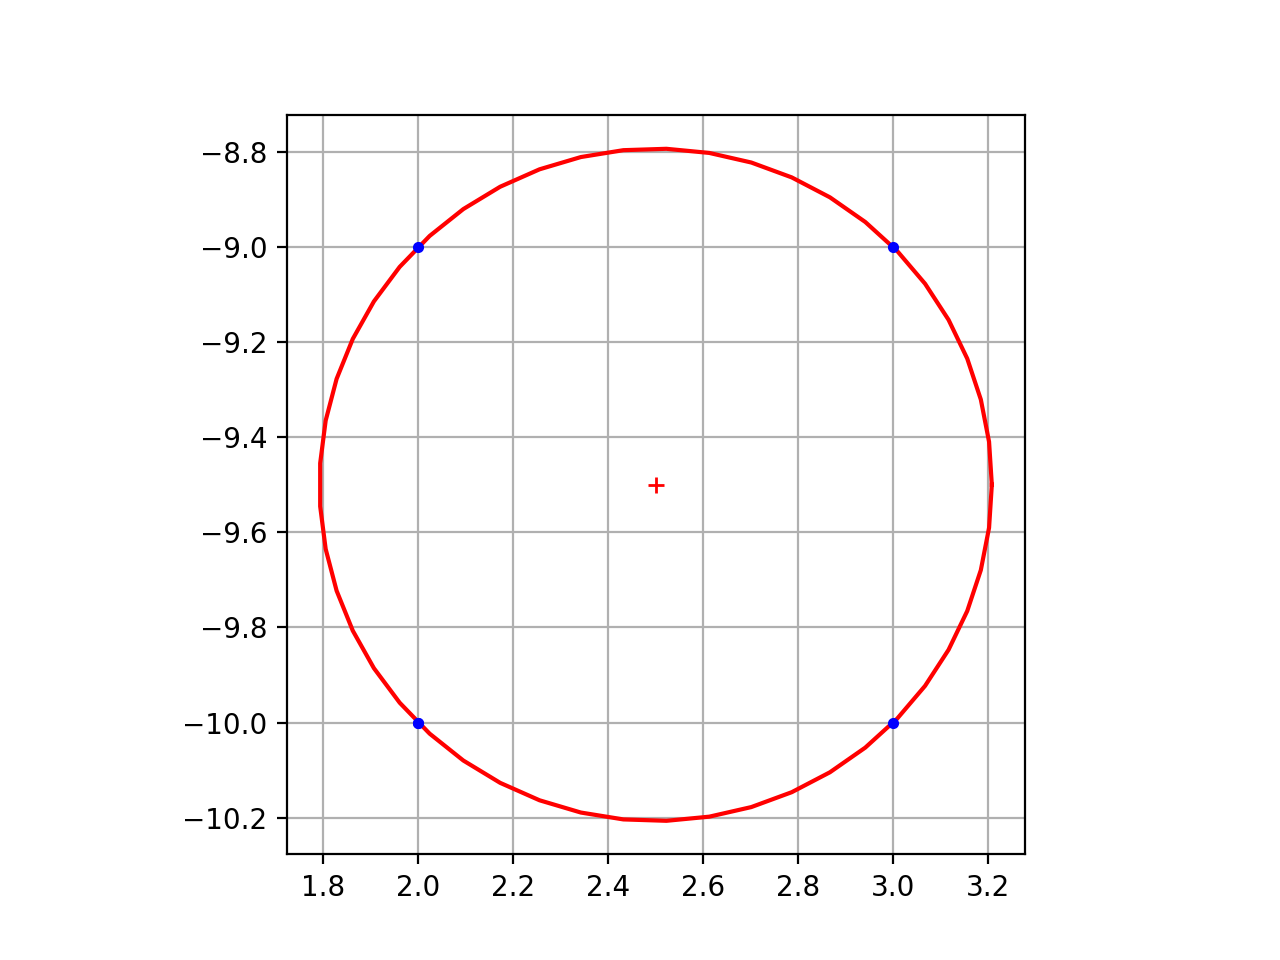
From a polygon, function will fit a circle.
Must be call with local coordinates (in m, to get a radius in m).
\[(x_i - x_0)^2 + (y_i - y_0)^2 = r^2\]\[x_i^2 - 2 x_i x_0 + x_0^2 + y_i^2 - 2 y_i y_0 + y_0^2 = r^2\]\[2 x_0 x_i + 2 y_0 y_i + r^2 - x_0^2 - y_0^2 = x_i^2 + y_i^2\]we get this linear equation
\[a X + b Y + c = Z\]where :
\[a = 2 x_0 , b = 2 y_0 , c = r^2 - x_0^2 - y_0^2\]\[X = x_i , Y = y_i , Z = x_i^2 + y_i^2\]Solutions:
\[x_0 = a / 2 , y_0 = b / 2 , r = \sqrt{c + x_0^2 + y_0^2}\]- Parameters:
x (array) – x of polygon
y (array) – y of polygon
- Returns:
x0, y0, radius, shape_error
- Return type:
import matplotlib.pyplot as plt
import numpy as np
from py_eddy_tracker.poly import fit_circle_
from py_eddy_tracker.generic import build_circle

V = np.array(((2, 2, 3, 3, 2), (-10, -9, -9, -10, -10)), dtype="f4")
x0, y0, radius, err = fit_circle_(V[0], V[1])
ax = plt.subplot(111)
ax.set_aspect("equal")
ax.grid(True)
ax.plot(*build_circle(x0, y0, radius), "r")
ax.plot(x0, y0, "r+")
ax.plot(*V, "b.")
plt.show()
(
Source code,png,hires.png,pdf)