py_eddy_tracker.observations.tracking.TrackEddiesObservations
- class py_eddy_tracker.observations.tracking.TrackEddiesObservations(*args, **kwargs)[source]
Bases:
py_eddy_tracker.observations.groups.GroupEddiesObservationsClass to practice Tracking on observations
Methods
Add a field of distance (m) between two consecutive observations, 0 for the last observation of each track
add_fieldsAdd a new field.
add_rotation_typealign_onAlign the time indices of two datasets.
appendMerge.
basic_formula_ellipse_major_axisGive major axis in km with a given latitude
bins_stat- param str,array xname
variable to compute stats on
box_displayReturn values evenly spaced with few numbers
build_var_listcircle_contourSet contours as circles from radius and center data.
Get close trajectories from another atlas.
coherenceCheck coherence between two datasets.
compare_unitsIf obs are not sorted by track, __first_index_of_track will be unusable
containsReturn index of contour containing (x,y)
copycopy_data_to_zarrCopy with buffer for zarr.
cost_functionReturn the cost function between two obs.
cost_function_common_areaHow does it work on x bound ?
Count by track
create_particlescreate particles only inside speed contour.
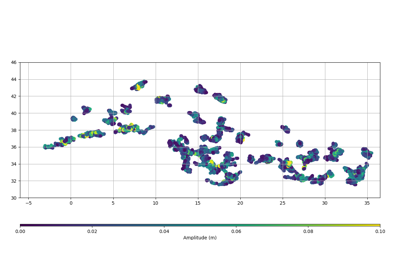
create_variablecreate_variable_zarrdisplayPlot the speed and effective (dashed) contour of the eddies
This function draws the shape of each trajectory
distanceUse haversine distance for distance matrix between every self and other eddies.
- return
array of distance in m, 0 when next obs is from another track
Select the trajectories longer than nb_min
Get trajectories going in the same direction
extract_with_areaExtract geographically with a bounding box.
Return the observations within trajectories lasting between [b0:b1]
Extract a subset of observations
Extract within a time period
field_tableProduce description table of the fields available in this object
filled- param matplotlib.axes.Axes ax
matplotlib axe used to draw
filled_by_interpolationFill selected values by interpolation
first_obsGet first obs of each trajectory.
Function used after ‘insert_virtual’, to correct next_obs and previous obs.
fixed_ellipsoid_maskAssociate the observations to the segments
from_netcdffrom_zarrReturn azimuth for each track.
get_colorReturn colors as a cyclic list
get_infosFind indices where observations are missing.
Forward association of observations to the segments
Backward association of observations to the segments
grid_box_statGet percentile of eddies in each bin
grid_countCount the eddies in each bin (use all pixels in each contour)
grid_statReturn the mean of the eddies’ variable in each bin
histBuild histograms.
indexReturn obs from self at the index.
insert_observationsInsert other obs in self at the given index.
insert_virtualinsert virtual observations on segments where observations are missing
insideTrue for each point inside the effective contour of an eddy
interninterp_gridInterpolate a grid on a center or contour with mean, min or max method
is_convexGet flag of the eddy’s convexity
iter_onYield observation group for each bin.
Yield track
keep_tracks_by_dateFind tracks that exist at date date and lasted at least nb_days after.
last_obsGet Last obs of each trajectory.
load_fileLoad the netcdf or the zarr file.
load_from_netcdfLoad data from netcdf.
load_from_zarrLoad data from zarr.
mask_from_polygonsReturn mask for all observations in one of polygons list
mask_functionmatchReturn index and score computed on the effective contour.
mergeMerge two datasets.
merge_filtersCompute an intersection between all filters after to evaluate each of them
needed_variablenetcdf_create_dimensionsnew_likeNormalize all longitudes
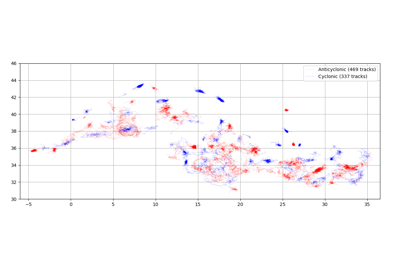
obs_dimensionparse_varnameThis function will draw path of each trajectory
post_process_linkpropagateFill virtual obs (C).
re_reference_indexShift index with ref
remove_fieldsCopy with fields listed remove
resetscatterScatter data.
Set global attributes
set_global_attr_zarrWill split one group (network) in segments
Get the polygon enclosing each trajectory.
shifted_ellipsoid_degrees_masksolve_conflictsolve_firstsolve_functionsolve_simultaneousWrite something (TODO)
Return each group (network) divided in segments
time_sub_sampleTime sub sampling
to_netcdfto_zarrtrackingTrack obs between self and other
write_fileWrite a netcdf or zarr with eddy obs.
zarr_dimensionAttributes
COLORSNB_COLORSReturn age in % for each observation, will be [0:100]
array_variablesdtypeReturn dtype to build numpy array.
Return all the names of the variables.
global_attrReturn lifetime for each observation
nb_daysReturn period in days covered by the dataset
Count and return number of track
obsReturn observations.
observationsonly_variablesperiodGive the time coverage.
period_raw_datashapesign_legendsign_typetrack_array_variablestrack_extra_variablestracks- ELEMENTS = ['lon', 'lat', 'radius_s', 'radius_e', 'speed_area', 'effective_area', 'amplitude', 'speed_average', 'time', 'shape_error_e', 'shape_error_s', 'nb_contour_selected', 'num_point_e', 'num_point_s', 'height_max_speed_contour', 'height_external_contour', 'height_inner_contour', 'cost_association']
- NOGROUP = 0
- add_distance()[source]
Add a field of distance (m) between two consecutive observations, 0 for the last observation of each track
- property age
Return age in % for each observation, will be [0:100]
- close_tracks(other, nb_obs_min=10, **kwargs)[source]
Get close trajectories from another atlas.
- Parameters
- Returns
return other atlas reduced to common trajectories with self
Warning
It could be a costly operation for huge dataset
- count_by_track(mask)[source]
Count by track
- Parameters
mask (array[bool]) – Mask of boolean count +1 if true
- Returns
Return count by track
- Return type
array
- display_shape(ax, ref=None, intern=False, **kwargs)[source]
This function draws the shape of each trajectory
- Parameters
ax (matplotlib.axes.Axes) – ax to draw
ref (float,int) – if defined, all coordinates are wrapped with ref as western boundary
intern (bool) – If True use speed contour instead of effective contour
kwargs (dict) – keyword arguments for Axes.plot
- Returns
matplotlib mappable
- distance_to_next()[source]
- Returns
array of distance in m, 0 when next obs is from another track
- Return type
array
- property elements
Return all the names of the variables.
- extract_longer_eddies(nb_min, nb_obs, compress_id=True)[source]
Select the trajectories longer than nb_min
- extract_toward_direction(west=True, delta_lon=None)[source]
Get trajectories going in the same direction
- extract_with_length(bounds)[source]
Return the observations within trajectories lasting between [b0:b1]
- extract_with_mask(mask, full_path=False, remove_incomplete=False, compress_id=False, reject_virtual=False)[source]
Extract a subset of observations
- Parameters
mask (array(bool)) – mask to select observations
full_path (bool) – extract the full trajectory if only one part is selected
remove_incomplete (bool) – delete trajectory if not fully selected
compress_id (bool) – resample trajectory number to use a smaller range
reject_virtual (bool) – if only virtuals are selected, the trajectory is removed
- Returns
same object with the selected observations
- Return type
self.__class__
- extract_with_period(period, **kwargs)[source]
Extract within a time period
- Parameters
period ((int,int)) – two dates to define the period, must be specified from 1/1/1950
kwargs (dict) – look at
extract_with_mask()
- Returns
Return all eddy tracks in period
- Return type
- fix_next_previous_obs()[source]
Function used after ‘insert_virtual’, to correct next_obs and previous obs.
- classmethod follow_obs(i_next, track_id, used, ids, *args, **kwargs)[source]
Associate the observations to the segments
- get_azimuth(equatorward=False)[source]
Return azimuth for each track.
Azimuth is computed with first and last observations
- Parameters
equatorward (bool) – If True, Poleward is positive and Equatorward negative
- Return type
array
- static get_next_obs(i_current, ids, x, y, time_s, time_e, time_ref, window, **kwargs)[source]
Forward association of observations to the segments
- static get_previous_obs(i_current, ids, x, y, time_s, time_e, time_ref, window, **kwargs)[source]
Backward association of observations to the segments
- property index_from_track
- property lifetime
Return lifetime for each observation
- property nb_obs_by_track
- property nb_tracks
Count and return number of track
- normalize_longitude()[source]
Normalize all longitudes
Normalize longitude field and in the same range : - longitude_max - contour_lon_e (how to do if in raw) - contour_lon_s (how to do if in raw)
- plot(ax, ref=None, **kwargs)[source]
This function will draw path of each trajectory
- Parameters
ax (matplotlib.axes.Axes) – ax to draw
ref (float,int) – if defined, all coordinates are wrapped with ref as western boundary
kwargs (dict) – keyword arguments for Axes.plot
- Returns
matplotlib mappable
- set_tracks(x, y, ids, window, **kwargs)[source]
Will split one group (network) in segments
- Parameters
x (array) – coordinates of group
y (array) – coordinates of group
ids (ndarray) – several fields like time, group, …
windows (int) – number of days where observations could missed