Installation
Toolbox gallery:
Grid manipulation
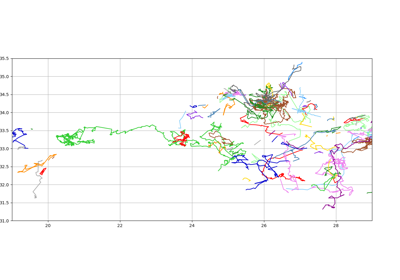
Tracking
Code
All figures in this gallery, used an experimental dataset, compute with this dataset : cmems_product.
How data is stored
Method to detect eddies from grid and display, with various parameters.
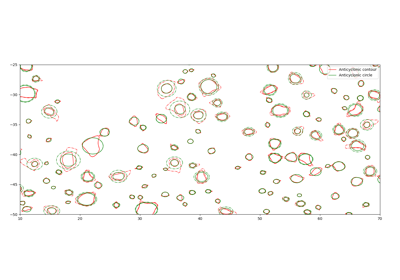
Display contour & circle
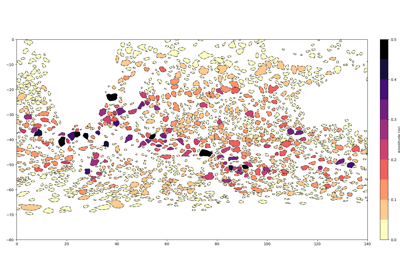
Display identification
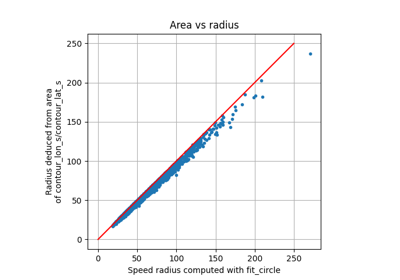
Radius vs area
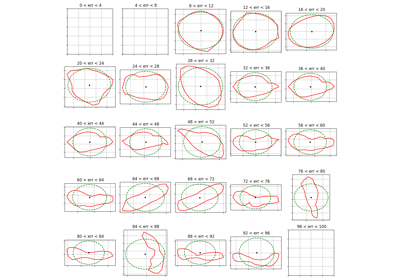
Shape error gallery
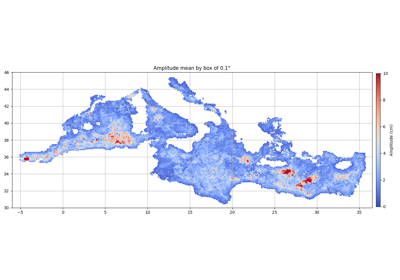
Get mean of grid in each eddies
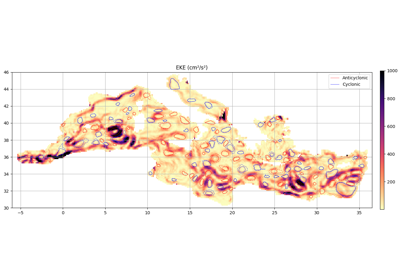
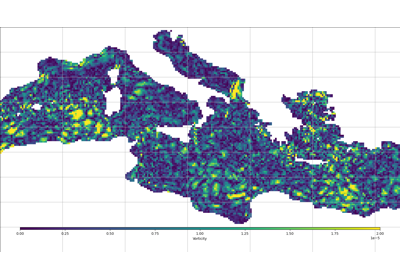
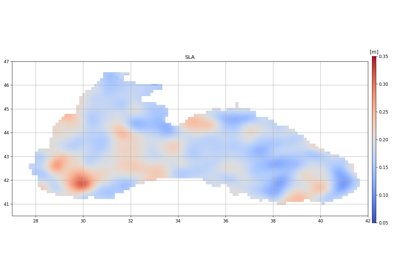
Eddy detection : Med
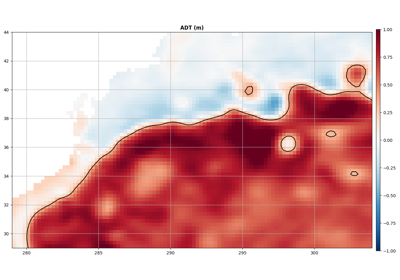
Eddy detection : Gulf stream
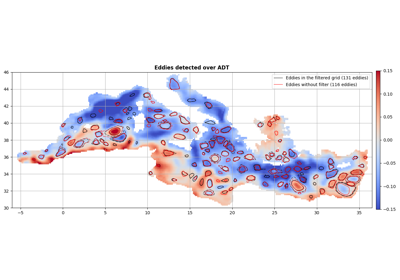
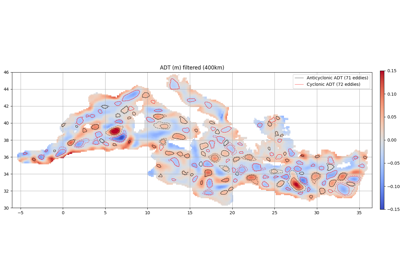
Eddy detection and filter
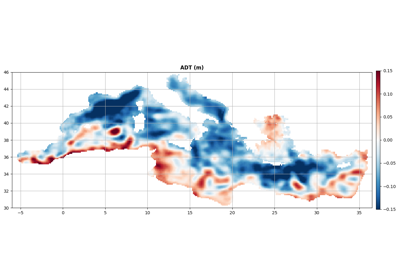
Eddy detection on SLA and ADT
Eddy detection : Antartic Circumpolar Current
Select pixel in eddies
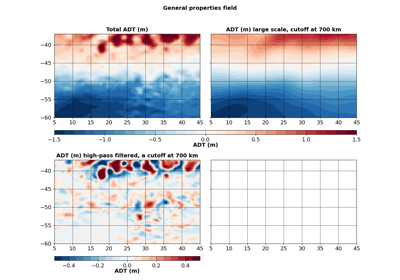
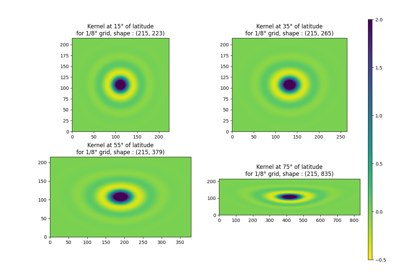
Grid filtering in PET
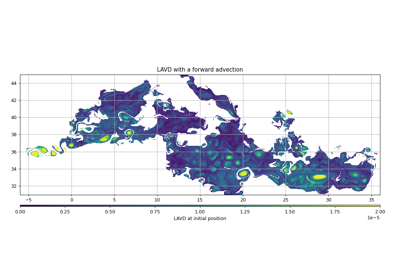
LAVD experiment
Get Okubo Weis
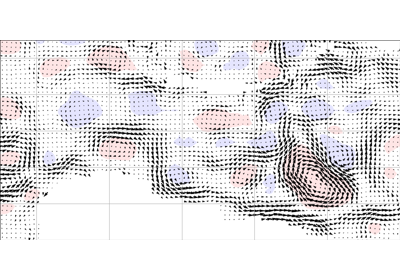
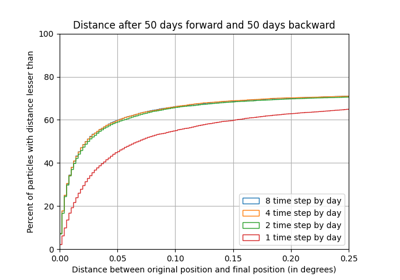
Grid advection
Warning
Time grid is under development, API could move quickly!
Time advection
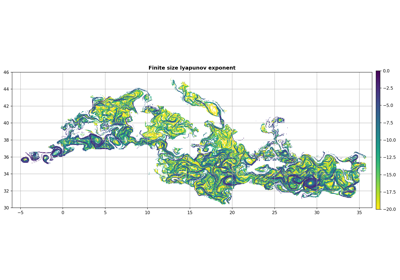
FSLE experiment in med
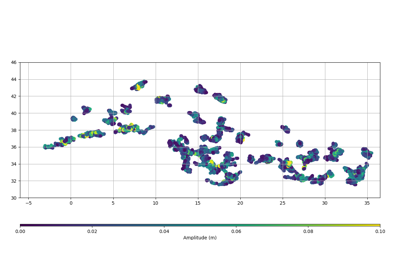
LAVD detection and geometric detection
Method to subset and display atlas.
Track animation
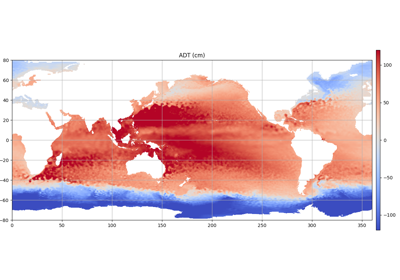
Display fields
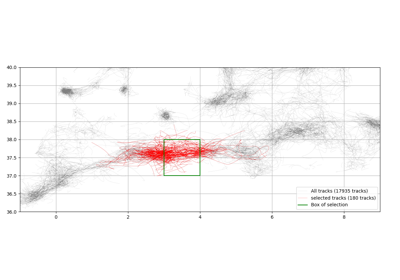
Tracks which go through area
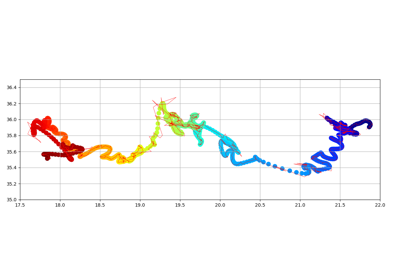
One Track
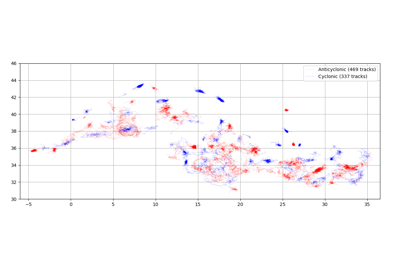
Display Tracks
Track in python
Track animation with standard matplotlib
Method to produce statistics with eddies atlas.
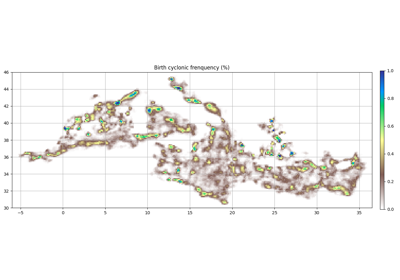
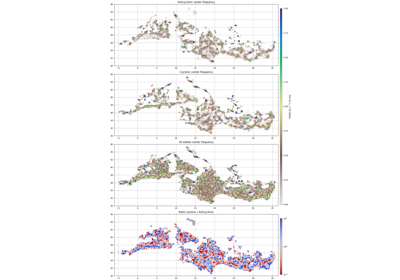
Geographical statistics
Birth and death
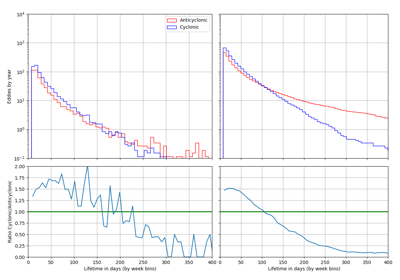
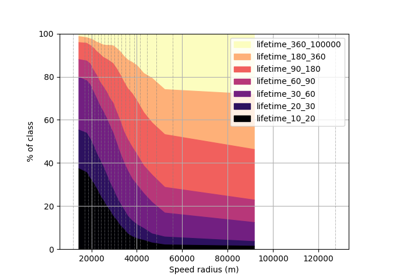
Lifetime Histogram
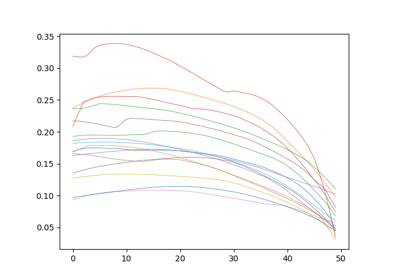
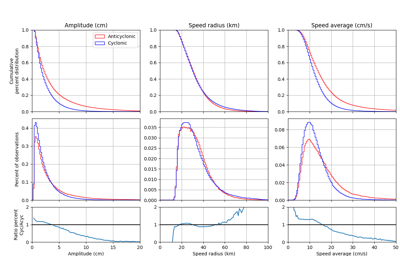
Parameter Histogram
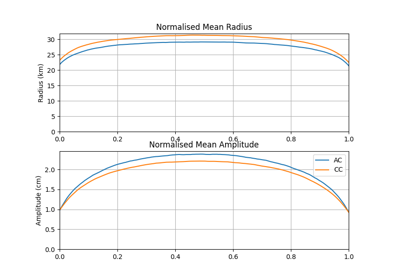
Normalised Eddy Lifetimes
Groups distribution
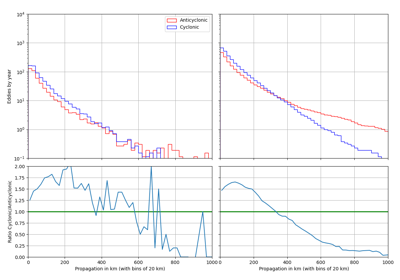
Propagation Histogram
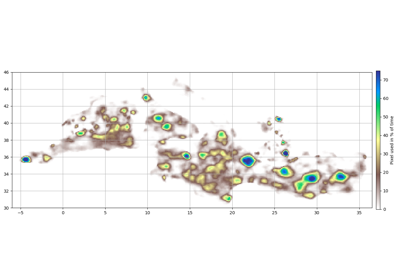
Count pixel used
Count center
Eddies comparison with external data
Collocating external data
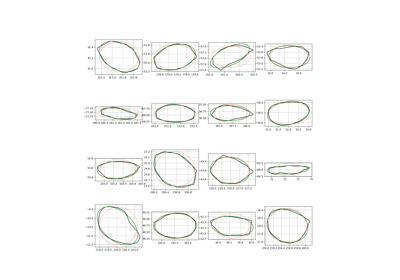
Method to work with contour
Contour fit
Visvalingam algorithm
Network is under development, API could move quickly!
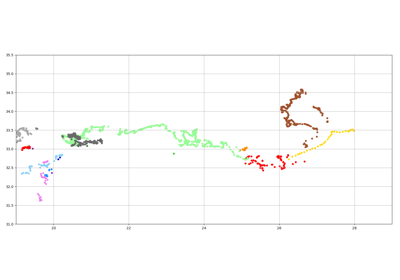
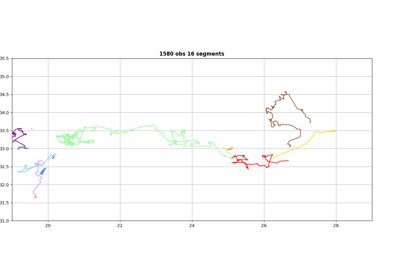
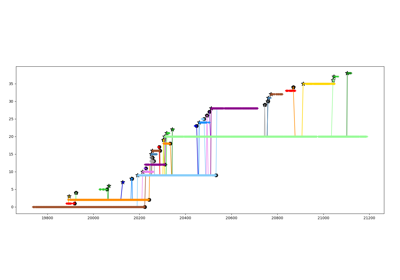
Network segmentation process
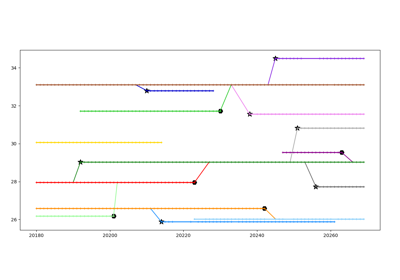
Network Analysis
Replay segmentation
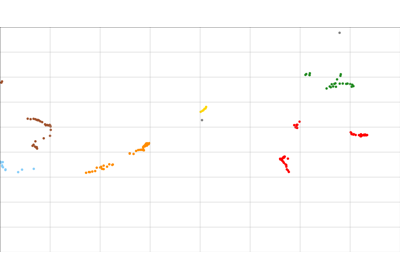
Network group process
Follow particle
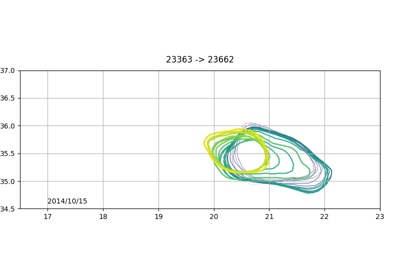
Ioannou case
Network basic manipulation
Gallery generated by Sphinx-Gallery