Spectrum
Compute spectrum and spectrum ratio on some area
Load data
raw = RegularGridDataset(grid_name, lon_name, lat_name)
filtered = RegularGridDataset(grid_name, lon_name, lat_name)
filtered.bessel_low_filter('adt', 150, order=3)

areas = dict(
    sud_pacific=dict(llcrnrlon=188, urcrnrlon=280, llcrnrlat=-64, urcrnrlat=-7),
    atlantic_nord=dict(llcrnrlon=290, urcrnrlon=340, llcrnrlat=19.5, urcrnrlat=43),
    indien_sud=dict(llcrnrlon=35, urcrnrlon=110, llcrnrlat=-49, urcrnrlat=-26),
)
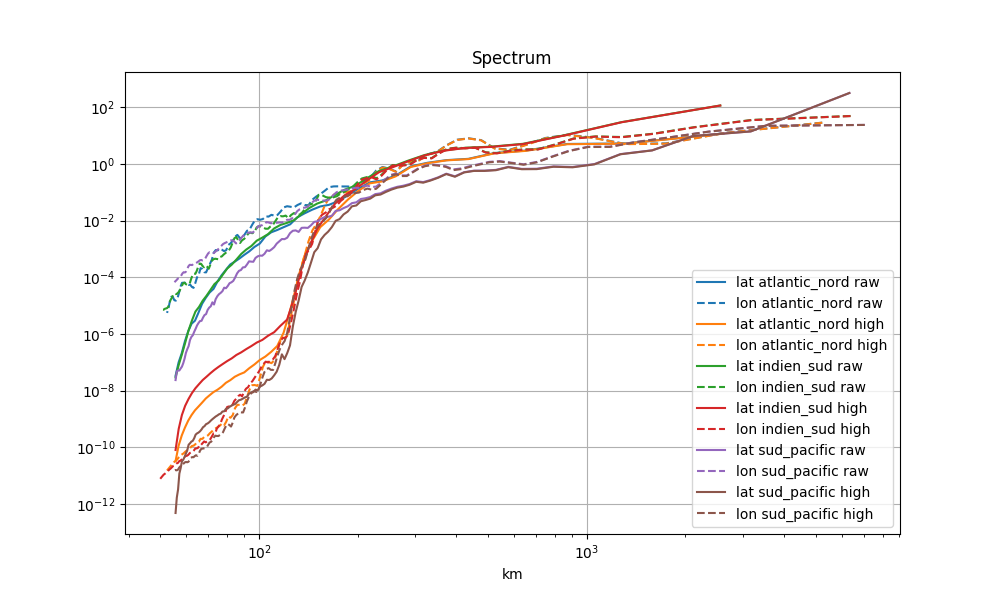
Compute and display spectrum
fig = plt.figure(figsize=(10,6))
ax = fig.add_subplot(111)
ax.set_title('Spectrum')
ax.set_xlabel('km')
for name_area, area in areas.items():

    lon_spec, lat_spec = raw.spectrum_lonlat('adt', area=area)
    mappable = ax.loglog(*lat_spec, label='lat %s raw' % name_area)[0]
    ax.loglog(*lon_spec, label='lon %s raw' % name_area, color=mappable.get_color(), linestyle='--')

    lon_spec, lat_spec = filtered.spectrum_lonlat('adt', area=area)
    mappable = ax.loglog(*lat_spec, label='lat %s high' % name_area)[0]
    ax.loglog(*lon_spec, label='lon %s high' % name_area, color=mappable.get_color(), linestyle='--')

ax.set_xscale('log')
ax.legend()
ax.grid()
fig.savefig('share/png/spectrum.png')
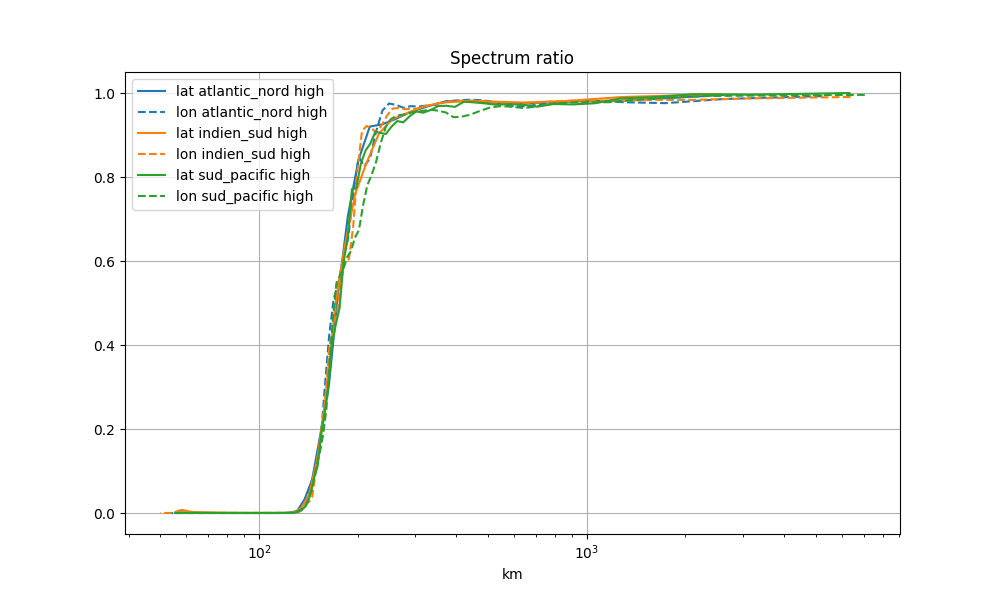
Compute and display spectrum ratio
fig = plt.figure(figsize=(10,6))
ax = fig.add_subplot(111)
ax.set_title('Spectrum ratio')
ax.set_xlabel('km')
for name_area, area in areas.items():
    lon_spec, lat_spec = filtered.spectrum_lonlat('adt', area=area, ref=raw)
    mappable = ax.plot(*lat_spec, label='lat %s high' % name_area)[0]
    ax.plot(*lon_spec, label='lon %s high' % name_area, color=mappable.get_color(), linestyle='--')

ax.set_xscale('log')
ax.legend()
ax.grid()
fig.savefig('share/png/spectrum_ratio.png')